Immigrants from South Eastern Asia vs Potawatomi Associate's Degree
COMPARE
Immigrants from South Eastern Asia
Potawatomi
Associate's Degree
Associate's Degree Comparison
Immigrants from South Eastern Asia
Potawatomi
45.2%
ASSOCIATE'S DEGREE
20.2/ 100
METRIC RATING
203rd/ 347
METRIC RANK
40.4%
ASSOCIATE'S DEGREE
0.1/ 100
METRIC RATING
275th/ 347
METRIC RANK
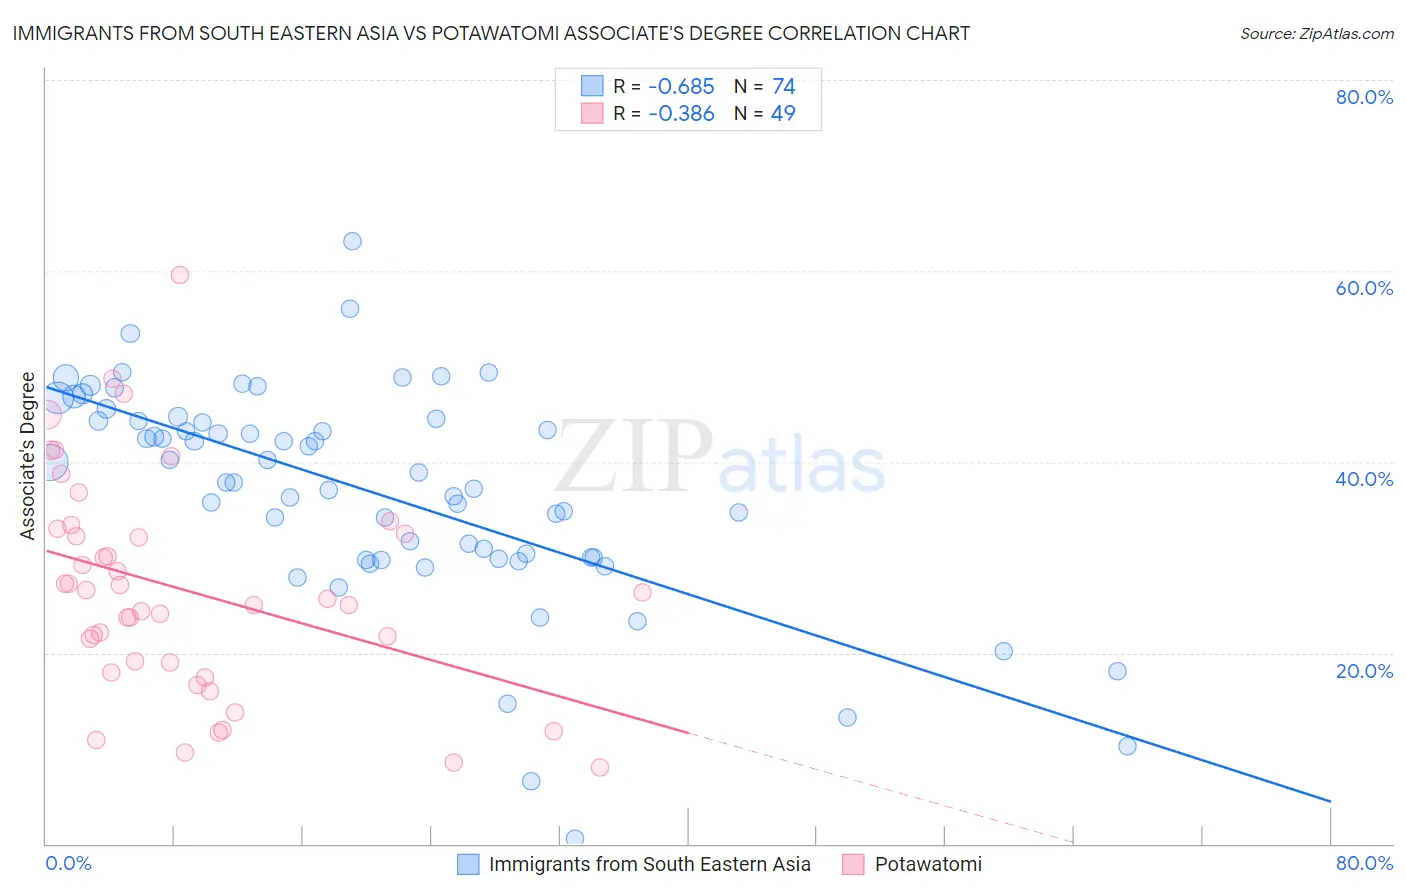
Immigrants from South Eastern Asia vs Potawatomi Associate's Degree Correlation Chart
The statistical analysis conducted on geographies consisting of 512,661,468 people shows a significant negative correlation between the proportion of Immigrants from South Eastern Asia and percentage of population with at least associate's degree education in the United States with a correlation coefficient (R) of -0.685 and weighted average of 45.2%. Similarly, the statistical analysis conducted on geographies consisting of 117,773,349 people shows a mild negative correlation between the proportion of Potawatomi and percentage of population with at least associate's degree education in the United States with a correlation coefficient (R) of -0.386 and weighted average of 40.4%, a difference of 11.8%.
Associate's Degree Correlation Summary
| Measurement | Immigrants from South Eastern Asia | Potawatomi |
| Minimum | 0.50% | 8.0% |
| Maximum | 63.1% | 59.6% |
| Range | 62.6% | 51.6% |
| Mean | 36.9% | 26.5% |
| Median | 38.4% | 25.7% |
| Interquartile 25% (IQ1) | 29.9% | 18.5% |
| Interquartile 75% (IQ3) | 44.3% | 32.7% |
| Interquartile Range (IQR) | 14.4% | 14.3% |
| Standard Deviation (Sample) | 11.4% | 11.3% |
| Standard Deviation (Population) | 11.3% | 11.2% |
Similar Demographics by Associate's Degree
Demographics Similar to Immigrants from South Eastern Asia by Associate's Degree
In terms of associate's degree, the demographic groups most similar to Immigrants from South Eastern Asia are Spaniard (45.2%, a difference of 0.020%), Immigrants from Vietnam (45.2%, a difference of 0.070%), Senegalese (45.2%, a difference of 0.10%), Immigrants from Senegal (45.2%, a difference of 0.11%), and Immigrants from Bangladesh (45.2%, a difference of 0.13%).
| Demographics | Rating | Rank | Associate's Degree |
| French | 25.6 /100 | #196 | Fair 45.4% |
| Scotch-Irish | 22.3 /100 | #197 | Fair 45.3% |
| Immigrants | Bangladesh | 21.3 /100 | #198 | Fair 45.2% |
| Immigrants | Senegal | 21.2 /100 | #199 | Fair 45.2% |
| Senegalese | 21.1 /100 | #200 | Fair 45.2% |
| Immigrants | Vietnam | 20.8 /100 | #201 | Fair 45.2% |
| Spaniards | 20.4 /100 | #202 | Fair 45.2% |
| Immigrants | South Eastern Asia | 20.2 /100 | #203 | Fair 45.2% |
| Nigerians | 19.1 /100 | #204 | Poor 45.1% |
| Immigrants | Thailand | 18.9 /100 | #205 | Poor 45.1% |
| German Russians | 18.9 /100 | #206 | Poor 45.1% |
| Panamanians | 18.4 /100 | #207 | Poor 45.1% |
| Dutch | 17.6 /100 | #208 | Poor 45.0% |
| Immigrants | Costa Rica | 16.7 /100 | #209 | Poor 45.0% |
| Immigrants | Philippines | 16.7 /100 | #210 | Poor 45.0% |
Demographics Similar to Potawatomi by Associate's Degree
In terms of associate's degree, the demographic groups most similar to Potawatomi are Puerto Rican (40.4%, a difference of 0.10%), Immigrants from Dominica (40.5%, a difference of 0.14%), Blackfeet (40.3%, a difference of 0.16%), Puget Sound Salish (40.5%, a difference of 0.28%), and Ottawa (40.3%, a difference of 0.30%).
| Demographics | Rating | Rank | Associate's Degree |
| Central American Indians | 0.2 /100 | #268 | Tragic 40.8% |
| Americans | 0.2 /100 | #269 | Tragic 40.8% |
| Chippewa | 0.2 /100 | #270 | Tragic 40.7% |
| Immigrants | Laos | 0.1 /100 | #271 | Tragic 40.7% |
| Belizeans | 0.1 /100 | #272 | Tragic 40.6% |
| Puget Sound Salish | 0.1 /100 | #273 | Tragic 40.5% |
| Immigrants | Dominica | 0.1 /100 | #274 | Tragic 40.5% |
| Potawatomi | 0.1 /100 | #275 | Tragic 40.4% |
| Puerto Ricans | 0.1 /100 | #276 | Tragic 40.4% |
| Blackfeet | 0.1 /100 | #277 | Tragic 40.3% |
| Ottawa | 0.1 /100 | #278 | Tragic 40.3% |
| Immigrants | Nicaragua | 0.1 /100 | #279 | Tragic 40.3% |
| Immigrants | Micronesia | 0.1 /100 | #280 | Tragic 40.2% |
| Immigrants | Portugal | 0.1 /100 | #281 | Tragic 40.1% |
| Bangladeshis | 0.1 /100 | #282 | Tragic 40.0% |