Immigrants from South Eastern Asia vs Barbadian 4th Grade
COMPARE
Immigrants from South Eastern Asia
Barbadian
4th Grade
4th Grade Comparison
Immigrants from South Eastern Asia
Barbadians
96.5%
4TH GRADE
0.0/ 100
METRIC RATING
300th/ 347
METRIC RANK
96.9%
4TH GRADE
0.1/ 100
METRIC RATING
280th/ 347
METRIC RANK
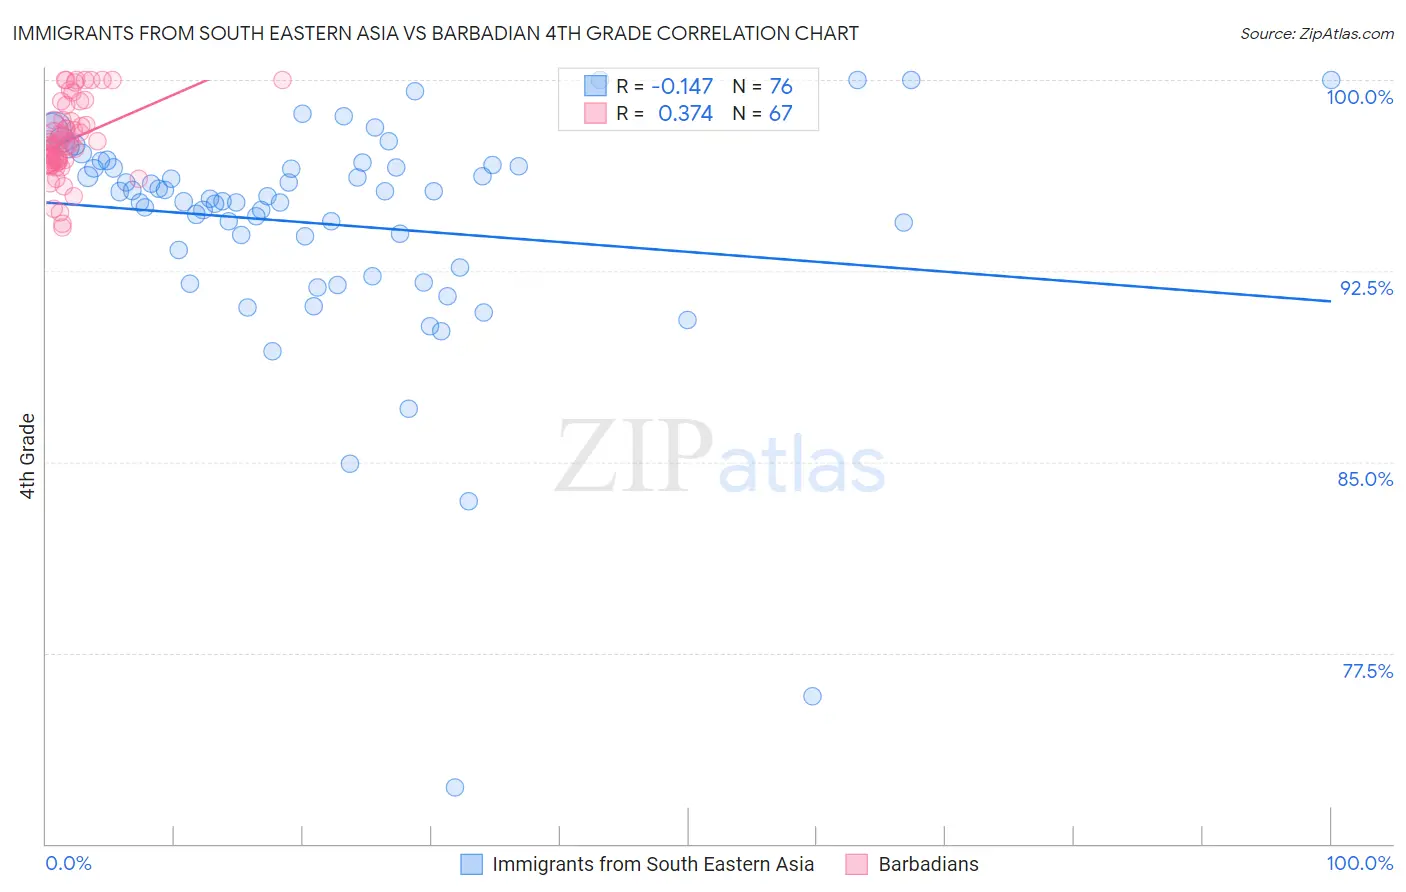
Immigrants from South Eastern Asia vs Barbadian 4th Grade Correlation Chart
The statistical analysis conducted on geographies consisting of 512,710,223 people shows a poor negative correlation between the proportion of Immigrants from South Eastern Asia and percentage of population with at least 4th grade education in the United States with a correlation coefficient (R) of -0.147 and weighted average of 96.5%. Similarly, the statistical analysis conducted on geographies consisting of 141,304,590 people shows a mild positive correlation between the proportion of Barbadians and percentage of population with at least 4th grade education in the United States with a correlation coefficient (R) of 0.374 and weighted average of 96.9%, a difference of 0.36%.
4th Grade Correlation Summary
| Measurement | Immigrants from South Eastern Asia | Barbadian |
| Minimum | 72.2% | 94.2% |
| Maximum | 100.0% | 100.0% |
| Range | 27.8% | 5.8% |
| Mean | 94.3% | 97.6% |
| Median | 95.4% | 97.5% |
| Interquartile 25% (IQ1) | 93.0% | 96.8% |
| Interquartile 75% (IQ3) | 96.6% | 98.4% |
| Interquartile Range (IQR) | 3.7% | 1.6% |
| Standard Deviation (Sample) | 4.6% | 1.4% |
| Standard Deviation (Population) | 4.6% | 1.4% |
Demographics Similar to Immigrants from South Eastern Asia and Barbadians by 4th Grade
In terms of 4th grade, the demographic groups most similar to Immigrants from South Eastern Asia are Haitian (96.5%, a difference of 0.010%), Immigrants from Dominica (96.5%, a difference of 0.010%), Immigrants from Somalia (96.5%, a difference of 0.040%), Somali (96.6%, a difference of 0.12%), and Immigrants from Portugal (96.6%, a difference of 0.13%). Similarly, the demographic groups most similar to Barbadians are Immigrants from Hong Kong (96.9%, a difference of 0.010%), Immigrants from Trinidad and Tobago (96.8%, a difference of 0.020%), Immigrants from Philippines (96.8%, a difference of 0.020%), Immigrants from St. Vincent and the Grenadines (96.8%, a difference of 0.040%), and Immigrants from Barbados (96.8%, a difference of 0.060%).
| Demographics | Rating | Rank | 4th Grade |
| Barbadians | 0.1 /100 | #280 | Tragic 96.9% |
| Immigrants | Hong Kong | 0.1 /100 | #281 | Tragic 96.9% |
| Immigrants | Trinidad and Tobago | 0.1 /100 | #282 | Tragic 96.8% |
| Immigrants | Philippines | 0.1 /100 | #283 | Tragic 96.8% |
| Immigrants | St. Vincent and the Grenadines | 0.1 /100 | #284 | Tragic 96.8% |
| Immigrants | Barbados | 0.0 /100 | #285 | Tragic 96.8% |
| Immigrants | Thailand | 0.0 /100 | #286 | Tragic 96.8% |
| Houma | 0.0 /100 | #287 | Tragic 96.8% |
| Immigrants | Afghanistan | 0.0 /100 | #288 | Tragic 96.8% |
| Immigrants | West Indies | 0.0 /100 | #289 | Tragic 96.7% |
| British West Indians | 0.0 /100 | #290 | Tragic 96.7% |
| Immigrants | Grenada | 0.0 /100 | #291 | Tragic 96.7% |
| Malaysians | 0.0 /100 | #292 | Tragic 96.7% |
| Puerto Ricans | 0.0 /100 | #293 | Tragic 96.7% |
| Immigrants | Eritrea | 0.0 /100 | #294 | Tragic 96.7% |
| Immigrants | Portugal | 0.0 /100 | #295 | Tragic 96.6% |
| Somalis | 0.0 /100 | #296 | Tragic 96.6% |
| Immigrants | Somalia | 0.0 /100 | #297 | Tragic 96.5% |
| Haitians | 0.0 /100 | #298 | Tragic 96.5% |
| Immigrants | Dominica | 0.0 /100 | #299 | Tragic 96.5% |
| Immigrants | South Eastern Asia | 0.0 /100 | #300 | Tragic 96.5% |