Immigrants from South Central Asia vs Venezuelan 5th Grade
COMPARE
Immigrants from South Central Asia
Venezuelan
5th Grade
5th Grade Comparison
Immigrants from South Central Asia
Venezuelans
97.5%
5TH GRADE
78.6/ 100
METRIC RATING
150th/ 347
METRIC RANK
97.3%
5TH GRADE
54.0/ 100
METRIC RATING
170th/ 347
METRIC RANK
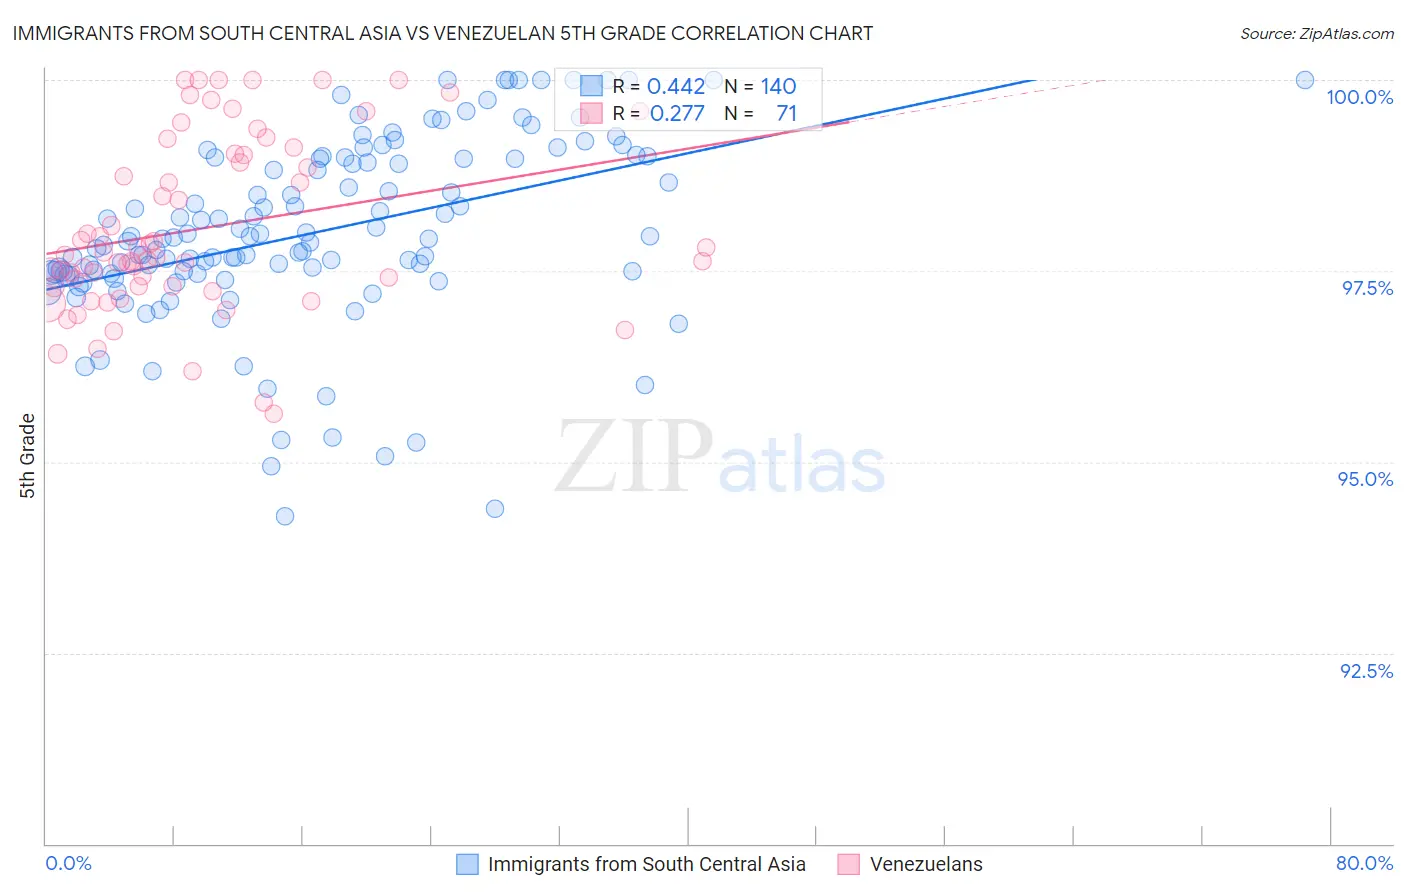
Immigrants from South Central Asia vs Venezuelan 5th Grade Correlation Chart
The statistical analysis conducted on geographies consisting of 473,113,181 people shows a moderate positive correlation between the proportion of Immigrants from South Central Asia and percentage of population with at least 5th grade education in the United States with a correlation coefficient (R) of 0.442 and weighted average of 97.5%. Similarly, the statistical analysis conducted on geographies consisting of 306,323,638 people shows a weak positive correlation between the proportion of Venezuelans and percentage of population with at least 5th grade education in the United States with a correlation coefficient (R) of 0.277 and weighted average of 97.3%, a difference of 0.12%.
5th Grade Correlation Summary
| Measurement | Immigrants from South Central Asia | Venezuelan |
| Minimum | 94.3% | 95.6% |
| Maximum | 100.0% | 100.0% |
| Range | 5.7% | 4.4% |
| Mean | 98.0% | 98.1% |
| Median | 97.9% | 97.7% |
| Interquartile 25% (IQ1) | 97.5% | 97.3% |
| Interquartile 75% (IQ3) | 99.0% | 99.0% |
| Interquartile Range (IQR) | 1.5% | 1.7% |
| Standard Deviation (Sample) | 1.2% | 1.1% |
| Standard Deviation (Population) | 1.2% | 1.1% |
Demographics Similar to Immigrants from South Central Asia and Venezuelans by 5th Grade
In terms of 5th grade, the demographic groups most similar to Immigrants from South Central Asia are Immigrants from Eastern Europe (97.4%, a difference of 0.020%), Ute (97.4%, a difference of 0.020%), Alsatian (97.4%, a difference of 0.020%), Immigrants from Russia (97.4%, a difference of 0.040%), and Immigrants from Bosnia and Herzegovina (97.4%, a difference of 0.040%). Similarly, the demographic groups most similar to Venezuelans are Immigrants from Belarus (97.3%, a difference of 0.0%), Chilean (97.3%, a difference of 0.0%), Immigrants from Korea (97.3%, a difference of 0.0%), Apache (97.4%, a difference of 0.010%), and Kenyan (97.4%, a difference of 0.020%).
| Demographics | Rating | Rank | 5th Grade |
| Immigrants | South Central Asia | 78.6 /100 | #150 | Good 97.5% |
| Immigrants | Eastern Europe | 75.0 /100 | #151 | Good 97.4% |
| Ute | 74.9 /100 | #152 | Good 97.4% |
| Alsatians | 74.3 /100 | #153 | Good 97.4% |
| Immigrants | Russia | 71.2 /100 | #154 | Good 97.4% |
| Immigrants | Bosnia and Herzegovina | 71.0 /100 | #155 | Good 97.4% |
| French American Indians | 70.5 /100 | #156 | Good 97.4% |
| Immigrants | Jordan | 70.4 /100 | #157 | Good 97.4% |
| Albanians | 68.3 /100 | #158 | Good 97.4% |
| Immigrants | Italy | 65.2 /100 | #159 | Good 97.4% |
| Marshallese | 61.2 /100 | #160 | Good 97.4% |
| Kenyans | 59.7 /100 | #161 | Average 97.4% |
| Immigrants | Iran | 59.5 /100 | #162 | Average 97.4% |
| Ugandans | 58.9 /100 | #163 | Average 97.4% |
| Bermudans | 58.8 /100 | #164 | Average 97.4% |
| Immigrants | Poland | 57.9 /100 | #165 | Average 97.4% |
| Apache | 57.2 /100 | #166 | Average 97.4% |
| Immigrants | Belarus | 54.6 /100 | #167 | Average 97.3% |
| Chileans | 54.5 /100 | #168 | Average 97.3% |
| Immigrants | Korea | 54.1 /100 | #169 | Average 97.3% |
| Venezuelans | 54.0 /100 | #170 | Average 97.3% |