Immigrants from South Central Asia vs Macedonian College, 1 year or more
COMPARE
Immigrants from South Central Asia
Macedonian
College, 1 year or more
College, 1 year or more Comparison
Immigrants from South Central Asia
Macedonians
67.1%
COLLEGE, 1 YEAR OR MORE
100.0/ 100
METRIC RATING
11th/ 347
METRIC RANK
61.8%
COLLEGE, 1 YEAR OR MORE
95.6/ 100
METRIC RATING
111th/ 347
METRIC RANK
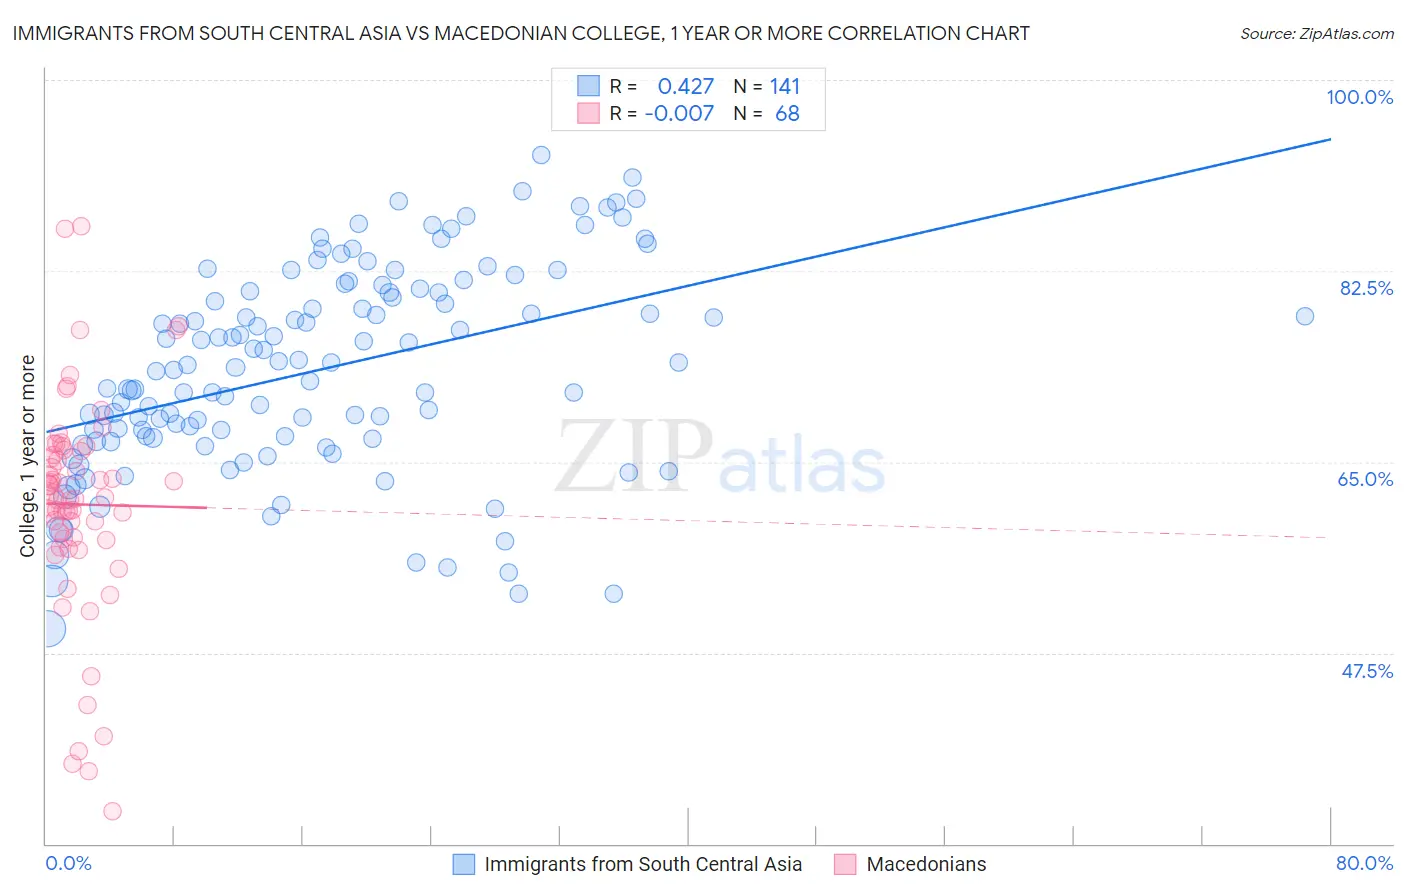
Immigrants from South Central Asia vs Macedonian College, 1 year or more Correlation Chart
The statistical analysis conducted on geographies consisting of 473,108,893 people shows a moderate positive correlation between the proportion of Immigrants from South Central Asia and percentage of population with at least college, 1 year or more education in the United States with a correlation coefficient (R) of 0.427 and weighted average of 67.1%. Similarly, the statistical analysis conducted on geographies consisting of 132,646,607 people shows no correlation between the proportion of Macedonians and percentage of population with at least college, 1 year or more education in the United States with a correlation coefficient (R) of -0.007 and weighted average of 61.8%, a difference of 8.6%.
College, 1 year or more Correlation Summary
| Measurement | Immigrants from South Central Asia | Macedonian |
| Minimum | 49.7% | 33.0% |
| Maximum | 93.2% | 86.6% |
| Range | 43.5% | 53.6% |
| Mean | 73.4% | 61.1% |
| Median | 73.7% | 61.7% |
| Interquartile 25% (IQ1) | 67.1% | 57.9% |
| Interquartile 75% (IQ3) | 80.6% | 66.0% |
| Interquartile Range (IQR) | 13.4% | 8.1% |
| Standard Deviation (Sample) | 9.4% | 10.1% |
| Standard Deviation (Population) | 9.3% | 10.1% |
Similar Demographics by College, 1 year or more
Demographics Similar to Immigrants from South Central Asia by College, 1 year or more
In terms of college, 1 year or more, the demographic groups most similar to Immigrants from South Central Asia are Cypriot (67.0%, a difference of 0.17%), Immigrants from Sweden (66.8%, a difference of 0.48%), Burmese (66.7%, a difference of 0.67%), Cambodian (66.7%, a difference of 0.67%), and Immigrants from Japan (66.7%, a difference of 0.71%).
| Demographics | Rating | Rank | College, 1 year or more |
| Immigrants | Taiwan | 100.0 /100 | #4 | Exceptional 69.6% |
| Immigrants | India | 100.0 /100 | #5 | Exceptional 69.6% |
| Immigrants | Iran | 100.0 /100 | #6 | Exceptional 69.5% |
| Okinawans | 100.0 /100 | #7 | Exceptional 69.0% |
| Thais | 100.0 /100 | #8 | Exceptional 68.6% |
| Immigrants | Israel | 100.0 /100 | #9 | Exceptional 67.8% |
| Immigrants | Australia | 100.0 /100 | #10 | Exceptional 67.7% |
| Immigrants | South Central Asia | 100.0 /100 | #11 | Exceptional 67.1% |
| Cypriots | 100.0 /100 | #12 | Exceptional 67.0% |
| Immigrants | Sweden | 100.0 /100 | #13 | Exceptional 66.8% |
| Burmese | 100.0 /100 | #14 | Exceptional 66.7% |
| Cambodians | 100.0 /100 | #15 | Exceptional 66.7% |
| Immigrants | Japan | 100.0 /100 | #16 | Exceptional 66.7% |
| Immigrants | Eastern Asia | 100.0 /100 | #17 | Exceptional 66.6% |
| Eastern Europeans | 100.0 /100 | #18 | Exceptional 66.6% |
Demographics Similar to Macedonians by College, 1 year or more
In terms of college, 1 year or more, the demographic groups most similar to Macedonians are European (61.8%, a difference of 0.0%), Syrian (61.9%, a difference of 0.020%), Immigrants from Northern Africa (61.9%, a difference of 0.020%), Immigrants from Ukraine (61.9%, a difference of 0.040%), and Austrian (61.8%, a difference of 0.060%).
| Demographics | Rating | Rank | College, 1 year or more |
| Chileans | 96.4 /100 | #104 | Exceptional 62.0% |
| Immigrants | Nepal | 96.3 /100 | #105 | Exceptional 62.0% |
| Palestinians | 96.3 /100 | #106 | Exceptional 62.0% |
| Immigrants | Ukraine | 95.8 /100 | #107 | Exceptional 61.9% |
| Syrians | 95.7 /100 | #108 | Exceptional 61.9% |
| Immigrants | Northern Africa | 95.7 /100 | #109 | Exceptional 61.9% |
| Europeans | 95.6 /100 | #110 | Exceptional 61.8% |
| Macedonians | 95.6 /100 | #111 | Exceptional 61.8% |
| Austrians | 95.4 /100 | #112 | Exceptional 61.8% |
| Ukrainians | 95.2 /100 | #113 | Exceptional 61.8% |
| Danes | 94.8 /100 | #114 | Exceptional 61.7% |
| Norwegians | 94.5 /100 | #115 | Exceptional 61.7% |
| Lebanese | 94.1 /100 | #116 | Exceptional 61.6% |
| Arabs | 93.9 /100 | #117 | Exceptional 61.6% |
| Immigrants | Brazil | 93.9 /100 | #118 | Exceptional 61.6% |