Immigrants from South America vs Immigrants from Mexico Doctorate Degree
COMPARE
Immigrants from South America
Immigrants from Mexico
Doctorate Degree
Doctorate Degree Comparison
Immigrants from South America
Immigrants from Mexico
1.8%
DOCTORATE DEGREE
23.3/ 100
METRIC RATING
199th/ 347
METRIC RANK
1.1%
DOCTORATE DEGREE
0.0/ 100
METRIC RATING
344th/ 347
METRIC RANK
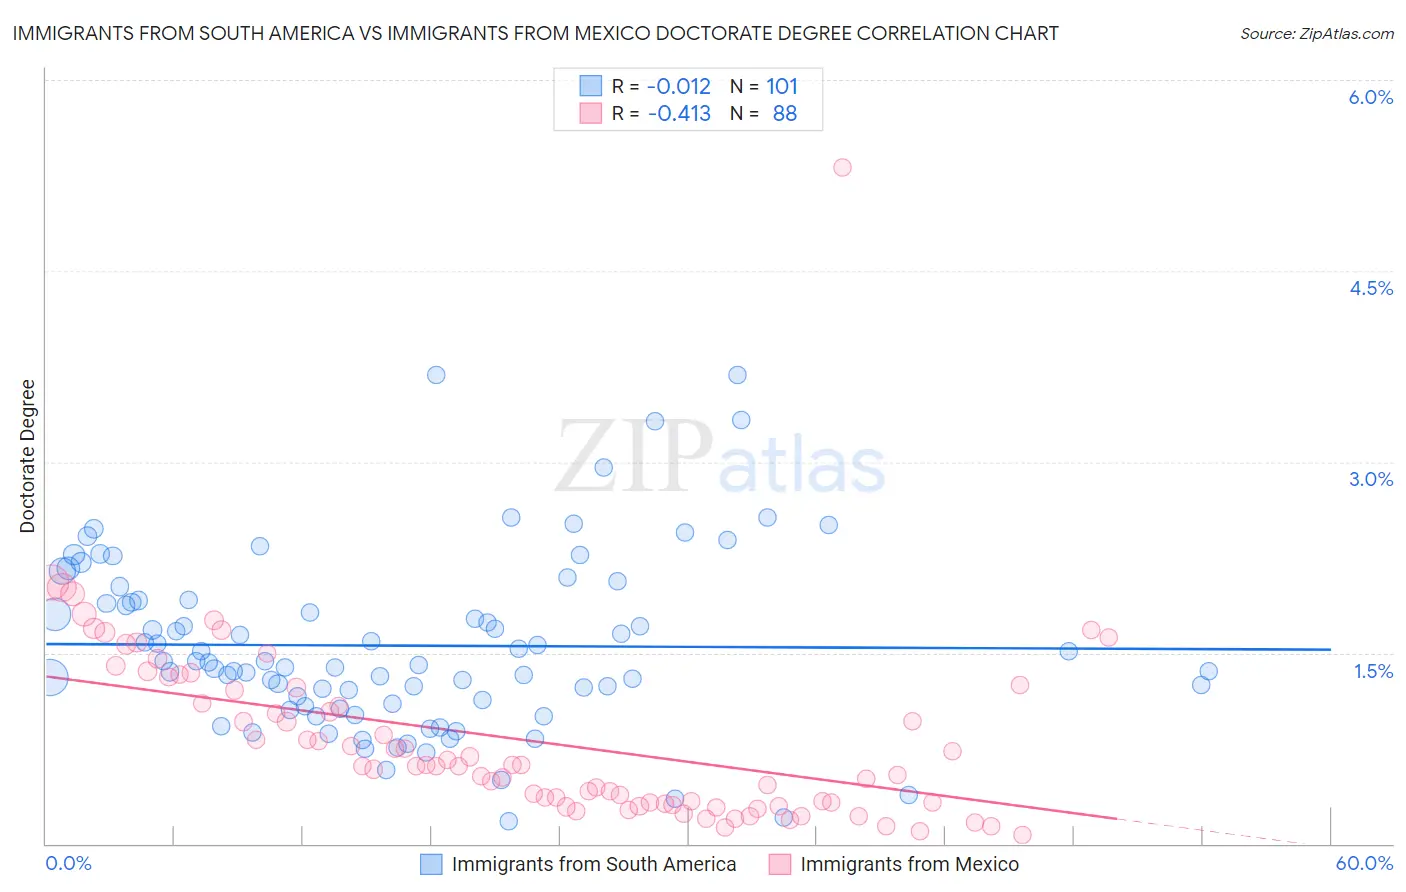
Immigrants from South America vs Immigrants from Mexico Doctorate Degree Correlation Chart
The statistical analysis conducted on geographies consisting of 479,287,152 people shows no correlation between the proportion of Immigrants from South America and percentage of population with at least doctorate degree education in the United States with a correlation coefficient (R) of -0.012 and weighted average of 1.8%. Similarly, the statistical analysis conducted on geographies consisting of 497,630,711 people shows a moderate negative correlation between the proportion of Immigrants from Mexico and percentage of population with at least doctorate degree education in the United States with a correlation coefficient (R) of -0.413 and weighted average of 1.1%, a difference of 59.1%.
Doctorate Degree Correlation Summary
| Measurement | Immigrants from South America | Immigrants from Mexico |
| Minimum | 0.18% | 0.070% |
| Maximum | 3.7% | 5.3% |
| Range | 3.5% | 5.2% |
| Mean | 1.6% | 0.81% |
| Median | 1.4% | 0.61% |
| Interquartile 25% (IQ1) | 1.1% | 0.32% |
| Interquartile 75% (IQ3) | 1.9% | 1.2% |
| Interquartile Range (IQR) | 0.82% | 0.90% |
| Standard Deviation (Sample) | 0.70% | 0.72% |
| Standard Deviation (Population) | 0.70% | 0.72% |
Similar Demographics by Doctorate Degree
Demographics Similar to Immigrants from South America by Doctorate Degree
In terms of doctorate degree, the demographic groups most similar to Immigrants from South America are White/Caucasian (1.8%, a difference of 0.11%), Immigrants from Nigeria (1.8%, a difference of 0.18%), Immigrants from Ghana (1.8%, a difference of 0.29%), Chinese (1.8%, a difference of 0.37%), and Subsaharan African (1.8%, a difference of 0.38%).
| Demographics | Rating | Rank | Doctorate Degree |
| Dutch | 27.4 /100 | #192 | Fair 1.8% |
| German Russians | 27.1 /100 | #193 | Fair 1.8% |
| Uruguayans | 26.2 /100 | #194 | Fair 1.8% |
| Immigrants | Somalia | 25.4 /100 | #195 | Fair 1.8% |
| Sub-Saharan Africans | 25.1 /100 | #196 | Fair 1.8% |
| Chinese | 25.1 /100 | #197 | Fair 1.8% |
| Immigrants | Ghana | 24.6 /100 | #198 | Fair 1.8% |
| Immigrants | South America | 23.3 /100 | #199 | Fair 1.8% |
| Whites/Caucasians | 22.8 /100 | #200 | Fair 1.8% |
| Immigrants | Nigeria | 22.4 /100 | #201 | Fair 1.8% |
| Portuguese | 21.4 /100 | #202 | Fair 1.8% |
| Immigrants | Vietnam | 21.4 /100 | #203 | Fair 1.8% |
| Somalis | 21.2 /100 | #204 | Fair 1.7% |
| Venezuelans | 19.5 /100 | #205 | Poor 1.7% |
| Immigrants | Peru | 17.6 /100 | #206 | Poor 1.7% |
Demographics Similar to Immigrants from Mexico by Doctorate Degree
In terms of doctorate degree, the demographic groups most similar to Immigrants from Mexico are Lumbee (1.1%, a difference of 1.5%), Fijian (1.1%, a difference of 2.1%), Spanish American Indian (1.1%, a difference of 4.4%), Arapaho (1.2%, a difference of 5.6%), and Mexican (1.2%, a difference of 5.9%).
| Demographics | Rating | Rank | Doctorate Degree |
| Immigrants | Caribbean | 0.0 /100 | #333 | Tragic 1.3% |
| Immigrants | Dominican Republic | 0.0 /100 | #334 | Tragic 1.3% |
| Immigrants | Haiti | 0.0 /100 | #335 | Tragic 1.3% |
| Nepalese | 0.0 /100 | #336 | Tragic 1.3% |
| Bangladeshis | 0.0 /100 | #337 | Tragic 1.2% |
| Puget Sound Salish | 0.0 /100 | #338 | Tragic 1.2% |
| Immigrants | Central America | 0.0 /100 | #339 | Tragic 1.2% |
| Immigrants | Cuba | 0.0 /100 | #340 | Tragic 1.2% |
| Mexicans | 0.0 /100 | #341 | Tragic 1.2% |
| Arapaho | 0.0 /100 | #342 | Tragic 1.2% |
| Fijians | 0.0 /100 | #343 | Tragic 1.1% |
| Immigrants | Mexico | 0.0 /100 | #344 | Tragic 1.1% |
| Lumbee | 0.0 /100 | #345 | Tragic 1.1% |
| Spanish American Indians | 0.0 /100 | #346 | Tragic 1.1% |
| Houma | 0.0 /100 | #347 | Tragic 0.96% |