Immigrants from South Africa vs Puerto Rican Nursery School
COMPARE
Immigrants from South Africa
Puerto Rican
Nursery School
Nursery School Comparison
Immigrants from South Africa
Puerto Ricans
98.3%
NURSERY SCHOOL
98.8/ 100
METRIC RATING
89th/ 347
METRIC RANK
97.7%
NURSERY SCHOOL
2.6/ 100
METRIC RATING
231st/ 347
METRIC RANK
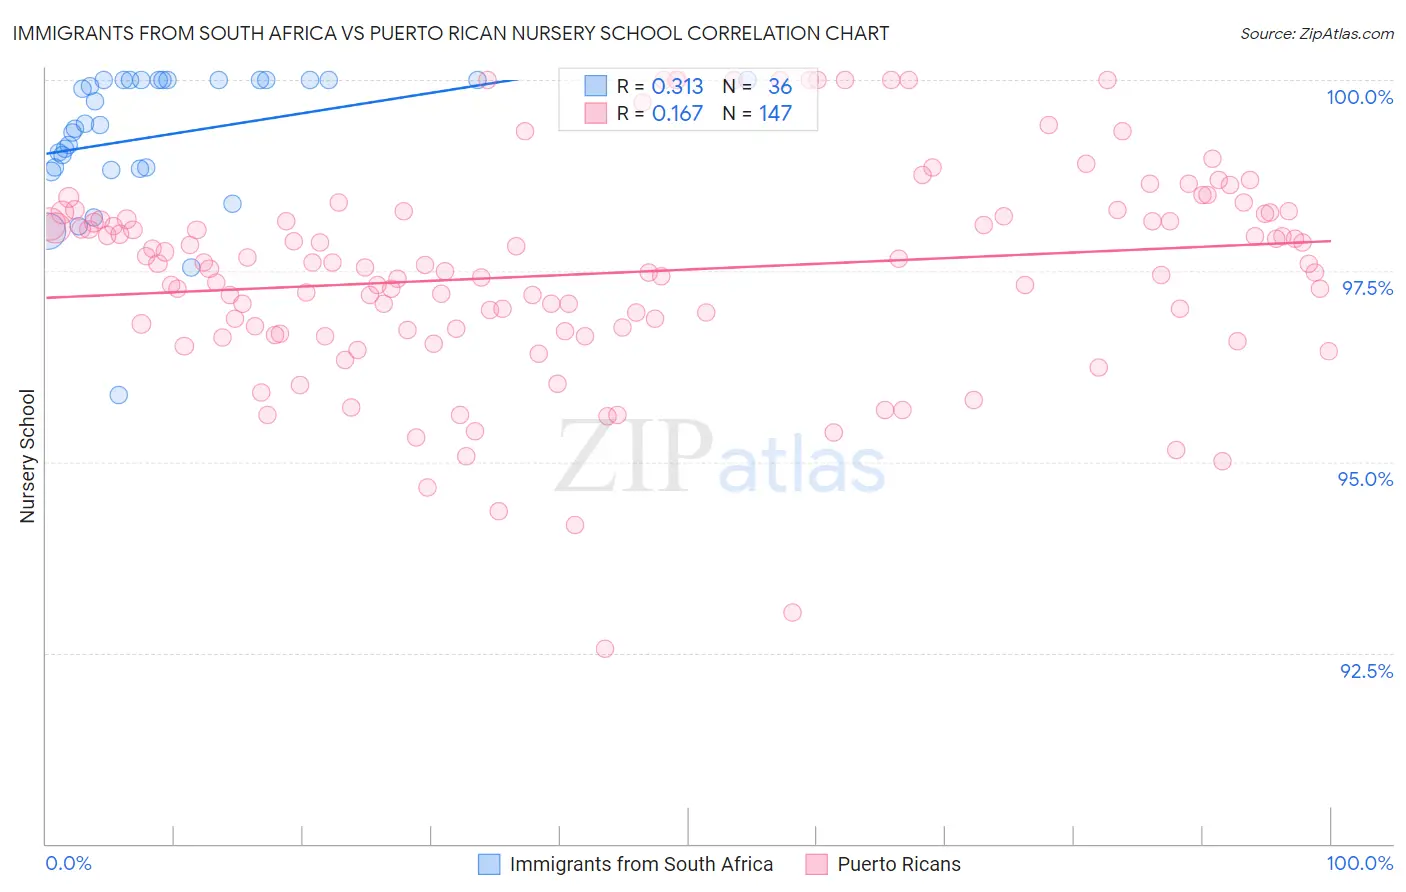
Immigrants from South Africa vs Puerto Rican Nursery School Correlation Chart
The statistical analysis conducted on geographies consisting of 233,321,693 people shows a mild positive correlation between the proportion of Immigrants from South Africa and percentage of population with at least nursery school education in the United States with a correlation coefficient (R) of 0.313 and weighted average of 98.3%. Similarly, the statistical analysis conducted on geographies consisting of 528,320,522 people shows a poor positive correlation between the proportion of Puerto Ricans and percentage of population with at least nursery school education in the United States with a correlation coefficient (R) of 0.167 and weighted average of 97.7%, a difference of 0.61%.
Nursery School Correlation Summary
| Measurement | Immigrants from South Africa | Puerto Rican |
| Minimum | 95.9% | 92.6% |
| Maximum | 100.0% | 100.0% |
| Range | 4.1% | 7.4% |
| Mean | 99.3% | 97.5% |
| Median | 99.4% | 97.6% |
| Interquartile 25% (IQ1) | 98.8% | 96.7% |
| Interquartile 75% (IQ3) | 100.0% | 98.2% |
| Interquartile Range (IQR) | 1.2% | 1.5% |
| Standard Deviation (Sample) | 0.91% | 1.4% |
| Standard Deviation (Population) | 0.90% | 1.4% |
Similar Demographics by Nursery School
Demographics Similar to Immigrants from South Africa by Nursery School
In terms of nursery school, the demographic groups most similar to Immigrants from South Africa are Hopi (98.3%, a difference of 0.0%), Ukrainian (98.3%, a difference of 0.0%), Immigrants from Western Europe (98.3%, a difference of 0.0%), Zimbabwean (98.3%, a difference of 0.0%), and Immigrants from Australia (98.3%, a difference of 0.010%).
| Demographics | Rating | Rank | Nursery School |
| Potawatomi | 99.2 /100 | #82 | Exceptional 98.3% |
| Osage | 99.1 /100 | #83 | Exceptional 98.3% |
| Immigrants | Denmark | 99.1 /100 | #84 | Exceptional 98.3% |
| Immigrants | Sweden | 99.1 /100 | #85 | Exceptional 98.3% |
| Immigrants | Australia | 99.0 /100 | #86 | Exceptional 98.3% |
| Hopi | 98.9 /100 | #87 | Exceptional 98.3% |
| Ukrainians | 98.9 /100 | #88 | Exceptional 98.3% |
| Immigrants | South Africa | 98.8 /100 | #89 | Exceptional 98.3% |
| Immigrants | Western Europe | 98.8 /100 | #90 | Exceptional 98.3% |
| Zimbabweans | 98.8 /100 | #91 | Exceptional 98.3% |
| Macedonians | 98.7 /100 | #92 | Exceptional 98.3% |
| Immigrants | India | 98.7 /100 | #93 | Exceptional 98.3% |
| Immigrants | Germany | 98.6 /100 | #94 | Exceptional 98.3% |
| South Africans | 98.6 /100 | #95 | Exceptional 98.3% |
| Cypriots | 98.3 /100 | #96 | Exceptional 98.3% |
Demographics Similar to Puerto Ricans by Nursery School
In terms of nursery school, the demographic groups most similar to Puerto Ricans are Sierra Leonean (97.7%, a difference of 0.010%), Immigrants from Uruguay (97.7%, a difference of 0.010%), U.S. Virgin Islander (97.7%, a difference of 0.010%), Immigrants from Costa Rica (97.7%, a difference of 0.020%), and Iraqi (97.7%, a difference of 0.020%).
| Demographics | Rating | Rank | Nursery School |
| Immigrants | Nepal | 3.6 /100 | #224 | Tragic 97.7% |
| Immigrants | Costa Rica | 3.5 /100 | #225 | Tragic 97.7% |
| Iraqis | 3.5 /100 | #226 | Tragic 97.7% |
| Sub-Saharan Africans | 3.2 /100 | #227 | Tragic 97.7% |
| Sudanese | 3.2 /100 | #228 | Tragic 97.7% |
| Senegalese | 3.2 /100 | #229 | Tragic 97.7% |
| Sierra Leoneans | 2.9 /100 | #230 | Tragic 97.7% |
| Puerto Ricans | 2.6 /100 | #231 | Tragic 97.7% |
| Immigrants | Uruguay | 2.3 /100 | #232 | Tragic 97.7% |
| U.S. Virgin Islanders | 2.1 /100 | #233 | Tragic 97.7% |
| Colombians | 2.1 /100 | #234 | Tragic 97.7% |
| Immigrants | Pakistan | 2.1 /100 | #235 | Tragic 97.7% |
| Immigrants | Malaysia | 1.9 /100 | #236 | Tragic 97.7% |
| Immigrants | Western Asia | 1.9 /100 | #237 | Tragic 97.7% |
| Nigerians | 1.7 /100 | #238 | Tragic 97.7% |