Immigrants from South Africa vs Immigrants from Uzbekistan Master's Degree
COMPARE
Immigrants from South Africa
Immigrants from Uzbekistan
Master's Degree
Master's Degree Comparison
Immigrants from South Africa
Immigrants from Uzbekistan
18.8%
MASTER'S DEGREE
100.0/ 100
METRIC RATING
51st/ 347
METRIC RANK
17.9%
MASTER'S DEGREE
99.8/ 100
METRIC RATING
69th/ 347
METRIC RANK
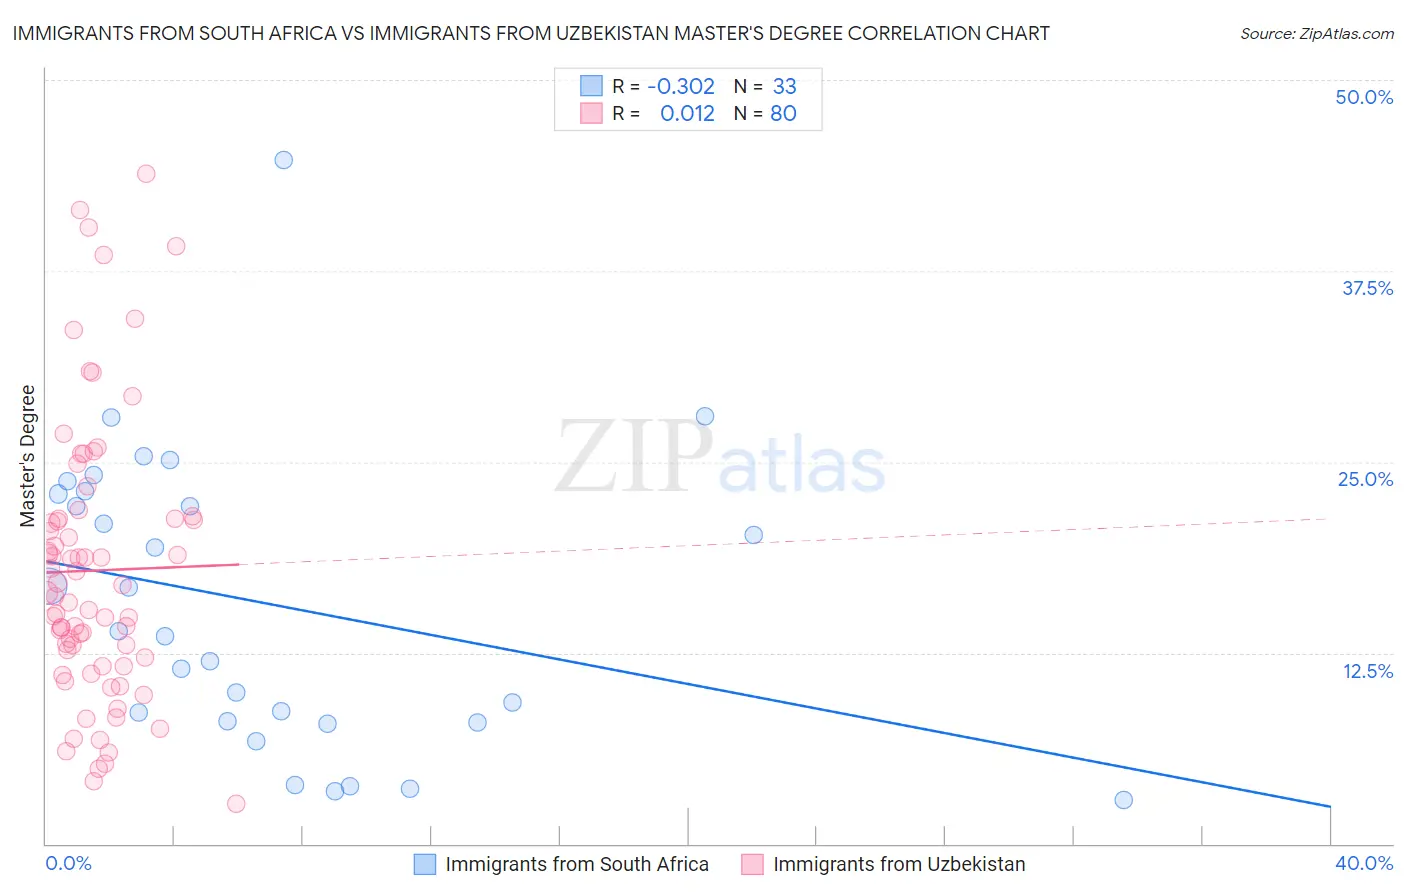
Immigrants from South Africa vs Immigrants from Uzbekistan Master's Degree Correlation Chart
The statistical analysis conducted on geographies consisting of 233,295,718 people shows a mild negative correlation between the proportion of Immigrants from South Africa and percentage of population with at least master's degree education in the United States with a correlation coefficient (R) of -0.302 and weighted average of 18.8%. Similarly, the statistical analysis conducted on geographies consisting of 118,739,422 people shows no correlation between the proportion of Immigrants from Uzbekistan and percentage of population with at least master's degree education in the United States with a correlation coefficient (R) of 0.012 and weighted average of 17.9%, a difference of 5.0%.
Master's Degree Correlation Summary
| Measurement | Immigrants from South Africa | Immigrants from Uzbekistan |
| Minimum | 2.9% | 2.6% |
| Maximum | 44.8% | 43.9% |
| Range | 41.9% | 41.3% |
| Mean | 15.7% | 17.9% |
| Median | 13.9% | 16.3% |
| Interquartile 25% (IQ1) | 8.0% | 11.9% |
| Interquartile 75% (IQ3) | 23.0% | 21.3% |
| Interquartile Range (IQR) | 15.0% | 9.4% |
| Standard Deviation (Sample) | 9.6% | 9.0% |
| Standard Deviation (Population) | 9.4% | 9.0% |
Demographics Similar to Immigrants from South Africa and Immigrants from Uzbekistan by Master's Degree
In terms of master's degree, the demographic groups most similar to Immigrants from South Africa are Bulgarian (18.8%, a difference of 0.010%), Immigrants from Kuwait (18.6%, a difference of 1.0%), Immigrants from Czechoslovakia (18.5%, a difference of 1.1%), Immigrants from Lithuania (18.5%, a difference of 1.4%), and Immigrants from Serbia (18.5%, a difference of 1.5%). Similarly, the demographic groups most similar to Immigrants from Uzbekistan are Immigrants from Western Europe (17.8%, a difference of 0.22%), Immigrants from Ethiopia (17.9%, a difference of 0.33%), Immigrants from Argentina (18.0%, a difference of 0.55%), Ethiopian (18.0%, a difference of 0.60%), and Immigrants from Kazakhstan (18.0%, a difference of 0.62%).
| Demographics | Rating | Rank | Master's Degree |
| Bulgarians | 100.0 /100 | #50 | Exceptional 18.8% |
| Immigrants | South Africa | 100.0 /100 | #51 | Exceptional 18.8% |
| Immigrants | Kuwait | 100.0 /100 | #52 | Exceptional 18.6% |
| Immigrants | Czechoslovakia | 99.9 /100 | #53 | Exceptional 18.5% |
| Immigrants | Lithuania | 99.9 /100 | #54 | Exceptional 18.5% |
| Immigrants | Serbia | 99.9 /100 | #55 | Exceptional 18.5% |
| Asians | 99.9 /100 | #56 | Exceptional 18.4% |
| Immigrants | Asia | 99.9 /100 | #57 | Exceptional 18.4% |
| Australians | 99.9 /100 | #58 | Exceptional 18.4% |
| Immigrants | Bulgaria | 99.9 /100 | #59 | Exceptional 18.3% |
| New Zealanders | 99.9 /100 | #60 | Exceptional 18.3% |
| Immigrants | Europe | 99.9 /100 | #61 | Exceptional 18.2% |
| Argentineans | 99.9 /100 | #62 | Exceptional 18.2% |
| Immigrants | Netherlands | 99.9 /100 | #63 | Exceptional 18.1% |
| South Africans | 99.9 /100 | #64 | Exceptional 18.1% |
| Immigrants | Kazakhstan | 99.8 /100 | #65 | Exceptional 18.0% |
| Ethiopians | 99.8 /100 | #66 | Exceptional 18.0% |
| Immigrants | Argentina | 99.8 /100 | #67 | Exceptional 18.0% |
| Immigrants | Ethiopia | 99.8 /100 | #68 | Exceptional 17.9% |
| Immigrants | Uzbekistan | 99.8 /100 | #69 | Exceptional 17.9% |
| Immigrants | Western Europe | 99.8 /100 | #70 | Exceptional 17.8% |