Immigrants from South Africa vs Immigrants from Sierra Leone College, Under 1 year
COMPARE
Immigrants from South Africa
Immigrants from Sierra Leone
College, Under 1 year
College, Under 1 year Comparison
Immigrants from South Africa
Immigrants from Sierra Leone
70.6%
COLLEGE, UNDER 1 YEAR
99.9/ 100
METRIC RATING
33rd/ 347
METRIC RANK
65.1%
COLLEGE, UNDER 1 YEAR
39.7/ 100
METRIC RATING
186th/ 347
METRIC RANK
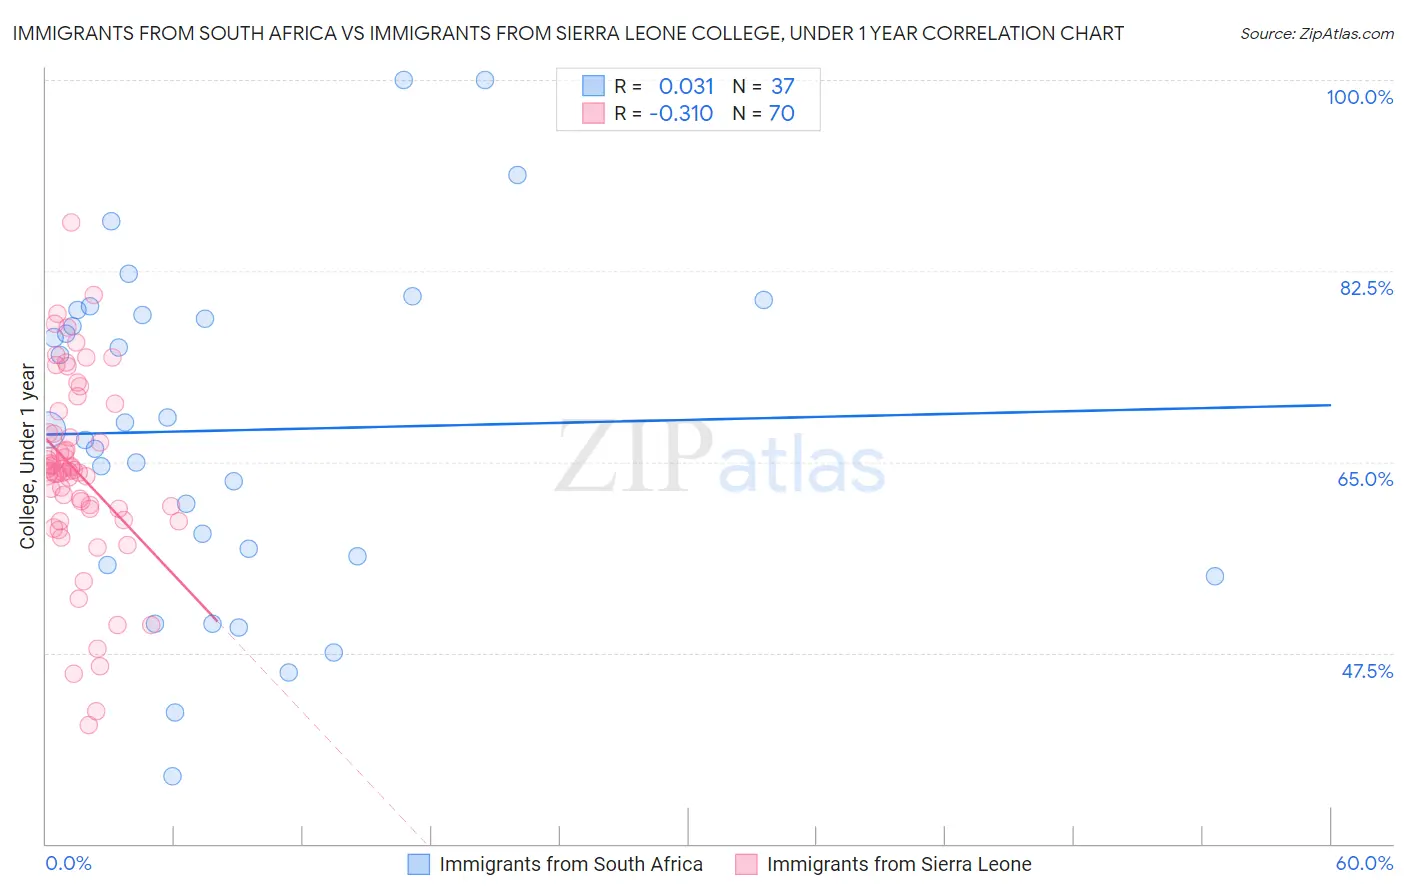
Immigrants from South Africa vs Immigrants from Sierra Leone College, Under 1 year Correlation Chart
The statistical analysis conducted on geographies consisting of 233,321,300 people shows no correlation between the proportion of Immigrants from South Africa and percentage of population with at least college, under 1 year education in the United States with a correlation coefficient (R) of 0.031 and weighted average of 70.6%. Similarly, the statistical analysis conducted on geographies consisting of 101,652,497 people shows a mild negative correlation between the proportion of Immigrants from Sierra Leone and percentage of population with at least college, under 1 year education in the United States with a correlation coefficient (R) of -0.310 and weighted average of 65.1%, a difference of 8.4%.
College, Under 1 year Correlation Summary
| Measurement | Immigrants from South Africa | Immigrants from Sierra Leone |
| Minimum | 36.2% | 40.8% |
| Maximum | 100.0% | 87.0% |
| Range | 63.8% | 46.2% |
| Mean | 67.9% | 64.1% |
| Median | 68.0% | 64.2% |
| Interquartile 25% (IQ1) | 56.0% | 60.7% |
| Interquartile 75% (IQ3) | 78.7% | 67.7% |
| Interquartile Range (IQR) | 22.8% | 7.0% |
| Standard Deviation (Sample) | 15.4% | 8.8% |
| Standard Deviation (Population) | 15.2% | 8.7% |
Similar Demographics by College, Under 1 year
Demographics Similar to Immigrants from South Africa by College, Under 1 year
In terms of college, under 1 year, the demographic groups most similar to Immigrants from South Africa are Estonian (70.6%, a difference of 0.020%), Russian (70.5%, a difference of 0.10%), Immigrants from Sri Lanka (70.5%, a difference of 0.16%), Turkish (70.7%, a difference of 0.17%), and Indian (Asian) (70.8%, a difference of 0.25%).
| Demographics | Rating | Rank | College, Under 1 year |
| Immigrants | Denmark | 100.0 /100 | #26 | Exceptional 71.0% |
| Immigrants | Ireland | 100.0 /100 | #27 | Exceptional 71.0% |
| Immigrants | Hong Kong | 100.0 /100 | #28 | Exceptional 71.0% |
| Immigrants | France | 100.0 /100 | #29 | Exceptional 71.0% |
| Immigrants | China | 99.9 /100 | #30 | Exceptional 70.9% |
| Indians (Asian) | 99.9 /100 | #31 | Exceptional 70.8% |
| Turks | 99.9 /100 | #32 | Exceptional 70.7% |
| Immigrants | South Africa | 99.9 /100 | #33 | Exceptional 70.6% |
| Estonians | 99.9 /100 | #34 | Exceptional 70.6% |
| Russians | 99.9 /100 | #35 | Exceptional 70.5% |
| Immigrants | Sri Lanka | 99.9 /100 | #36 | Exceptional 70.5% |
| Immigrants | Saudi Arabia | 99.9 /100 | #37 | Exceptional 70.4% |
| Australians | 99.9 /100 | #38 | Exceptional 70.4% |
| Bhutanese | 99.9 /100 | #39 | Exceptional 70.3% |
| Immigrants | Turkey | 99.9 /100 | #40 | Exceptional 70.3% |
Demographics Similar to Immigrants from Sierra Leone by College, Under 1 year
In terms of college, under 1 year, the demographic groups most similar to Immigrants from Sierra Leone are Sri Lankan (65.2%, a difference of 0.090%), Bermudan (65.2%, a difference of 0.10%), Immigrants from Poland (65.2%, a difference of 0.13%), Immigrants from Africa (65.3%, a difference of 0.23%), and Spaniard (65.3%, a difference of 0.26%).
| Demographics | Rating | Rank | College, Under 1 year |
| Guamanians/Chamorros | 48.2 /100 | #179 | Average 65.4% |
| Dutch | 46.1 /100 | #180 | Average 65.3% |
| Spaniards | 45.5 /100 | #181 | Average 65.3% |
| Immigrants | Africa | 44.7 /100 | #182 | Average 65.3% |
| Immigrants | Poland | 42.6 /100 | #183 | Average 65.2% |
| Bermudans | 42.0 /100 | #184 | Average 65.2% |
| Sri Lankans | 41.7 /100 | #185 | Average 65.2% |
| Immigrants | Sierra Leone | 39.7 /100 | #186 | Fair 65.1% |
| Immigrants | Southern Europe | 34.3 /100 | #187 | Fair 64.9% |
| Immigrants | Albania | 32.0 /100 | #188 | Fair 64.9% |
| Spanish | 31.6 /100 | #189 | Fair 64.9% |
| Immigrants | Philippines | 30.1 /100 | #190 | Fair 64.8% |
| Immigrants | Armenia | 28.1 /100 | #191 | Fair 64.7% |
| Immigrants | Thailand | 27.0 /100 | #192 | Fair 64.7% |
| Slovaks | 26.7 /100 | #193 | Fair 64.7% |