Immigrants from South Africa vs Immigrants from Malaysia College, 1 year or more
COMPARE
Immigrants from South Africa
Immigrants from Malaysia
College, 1 year or more
College, 1 year or more Comparison
Immigrants from South Africa
Immigrants from Malaysia
65.1%
COLLEGE, 1 YEAR OR MORE
99.9/ 100
METRIC RATING
36th/ 347
METRIC RANK
64.3%
COLLEGE, 1 YEAR OR MORE
99.8/ 100
METRIC RATING
51st/ 347
METRIC RANK
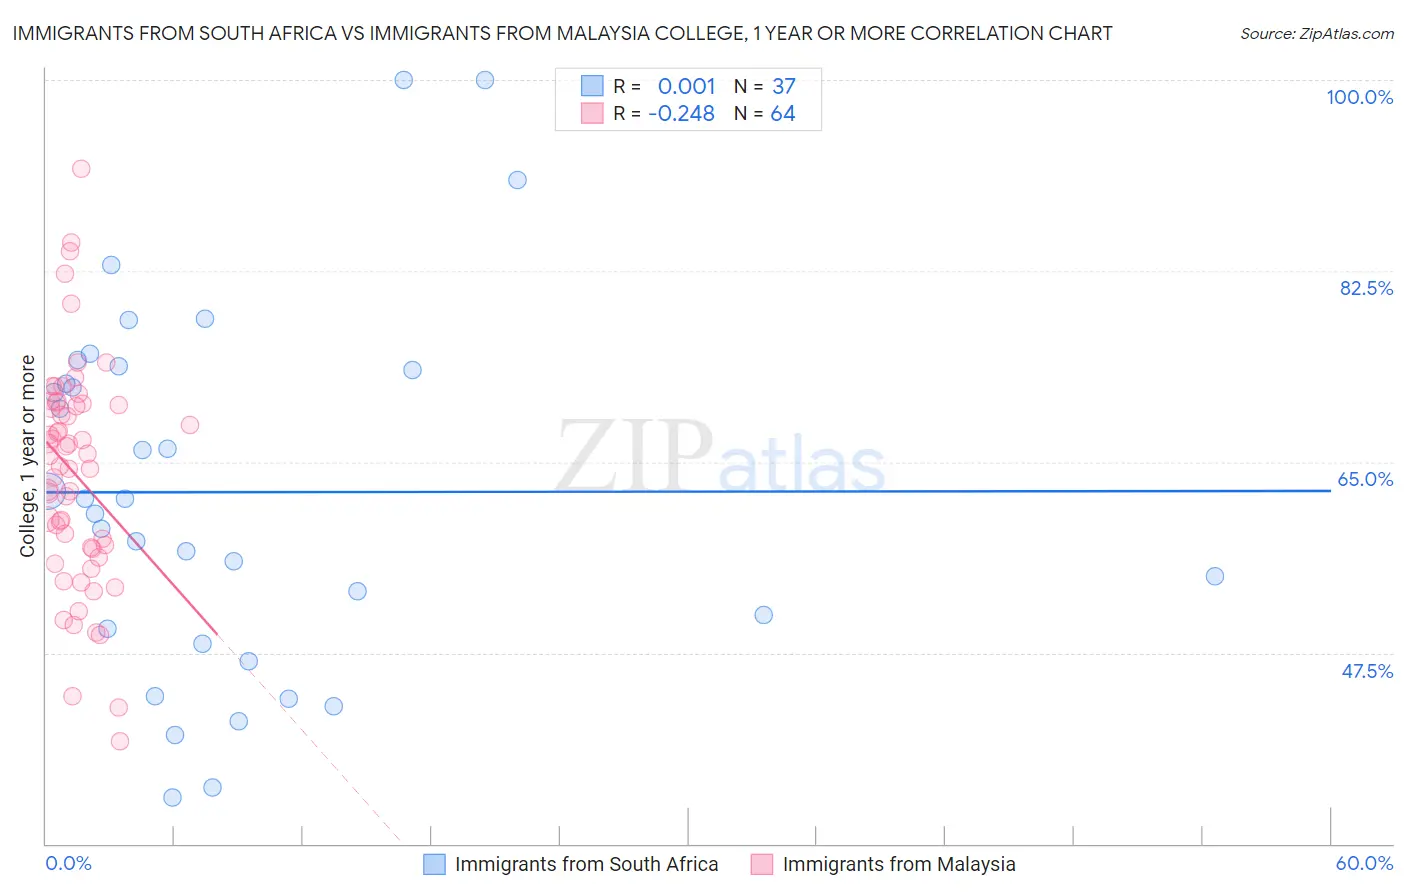
Immigrants from South Africa vs Immigrants from Malaysia College, 1 year or more Correlation Chart
The statistical analysis conducted on geographies consisting of 233,321,300 people shows no correlation between the proportion of Immigrants from South Africa and percentage of population with at least college, 1 year or more education in the United States with a correlation coefficient (R) of 0.001 and weighted average of 65.1%. Similarly, the statistical analysis conducted on geographies consisting of 197,973,854 people shows a weak negative correlation between the proportion of Immigrants from Malaysia and percentage of population with at least college, 1 year or more education in the United States with a correlation coefficient (R) of -0.248 and weighted average of 64.3%, a difference of 1.3%.
College, 1 year or more Correlation Summary
| Measurement | Immigrants from South Africa | Immigrants from Malaysia |
| Minimum | 34.2% | 39.4% |
| Maximum | 100.0% | 91.9% |
| Range | 65.8% | 52.5% |
| Mean | 62.2% | 63.9% |
| Median | 61.6% | 65.1% |
| Interquartile 25% (IQ1) | 49.0% | 57.1% |
| Interquartile 75% (IQ3) | 73.6% | 70.3% |
| Interquartile Range (IQR) | 24.6% | 13.1% |
| Standard Deviation (Sample) | 16.7% | 10.2% |
| Standard Deviation (Population) | 16.5% | 10.1% |
Demographics Similar to Immigrants from South Africa and Immigrants from Malaysia by College, 1 year or more
In terms of college, 1 year or more, the demographic groups most similar to Immigrants from South Africa are Russian (65.1%, a difference of 0.010%), Immigrants from Turkey (65.2%, a difference of 0.080%), Immigrants from Saudi Arabia (65.0%, a difference of 0.15%), Estonian (65.0%, a difference of 0.23%), and Israeli (65.3%, a difference of 0.28%). Similarly, the demographic groups most similar to Immigrants from Malaysia are Immigrants from Austria (64.4%, a difference of 0.080%), Immigrants from Netherlands (64.2%, a difference of 0.16%), Asian (64.2%, a difference of 0.18%), New Zealander (64.6%, a difference of 0.37%), and Immigrants from Bulgaria (64.6%, a difference of 0.41%).
| Demographics | Rating | Rank | College, 1 year or more |
| Immigrants | Sri Lanka | 99.9 /100 | #33 | Exceptional 65.4% |
| Israelis | 99.9 /100 | #34 | Exceptional 65.3% |
| Immigrants | Turkey | 99.9 /100 | #35 | Exceptional 65.2% |
| Immigrants | South Africa | 99.9 /100 | #36 | Exceptional 65.1% |
| Russians | 99.9 /100 | #37 | Exceptional 65.1% |
| Immigrants | Saudi Arabia | 99.9 /100 | #38 | Exceptional 65.0% |
| Estonians | 99.9 /100 | #39 | Exceptional 65.0% |
| Immigrants | Kuwait | 99.9 /100 | #40 | Exceptional 65.0% |
| Mongolians | 99.9 /100 | #41 | Exceptional 64.8% |
| Immigrants | Latvia | 99.9 /100 | #42 | Exceptional 64.8% |
| Immigrants | Russia | 99.9 /100 | #43 | Exceptional 64.7% |
| Immigrants | Norway | 99.9 /100 | #44 | Exceptional 64.7% |
| Immigrants | Lithuania | 99.9 /100 | #45 | Exceptional 64.6% |
| Bhutanese | 99.9 /100 | #46 | Exceptional 64.6% |
| Australians | 99.9 /100 | #47 | Exceptional 64.6% |
| Immigrants | Bulgaria | 99.9 /100 | #48 | Exceptional 64.6% |
| New Zealanders | 99.9 /100 | #49 | Exceptional 64.6% |
| Immigrants | Austria | 99.8 /100 | #50 | Exceptional 64.4% |
| Immigrants | Malaysia | 99.8 /100 | #51 | Exceptional 64.3% |
| Immigrants | Netherlands | 99.8 /100 | #52 | Exceptional 64.2% |
| Asians | 99.8 /100 | #53 | Exceptional 64.2% |