Immigrants from Somalia vs Indian (Asian) 7th Grade
COMPARE
Immigrants from Somalia
Indian (Asian)
7th Grade
7th Grade Comparison
Immigrants from Somalia
Indians (Asian)
95.2%
7TH GRADE
0.5/ 100
METRIC RATING
262nd/ 347
METRIC RANK
95.5%
7TH GRADE
2.3/ 100
METRIC RATING
238th/ 347
METRIC RANK
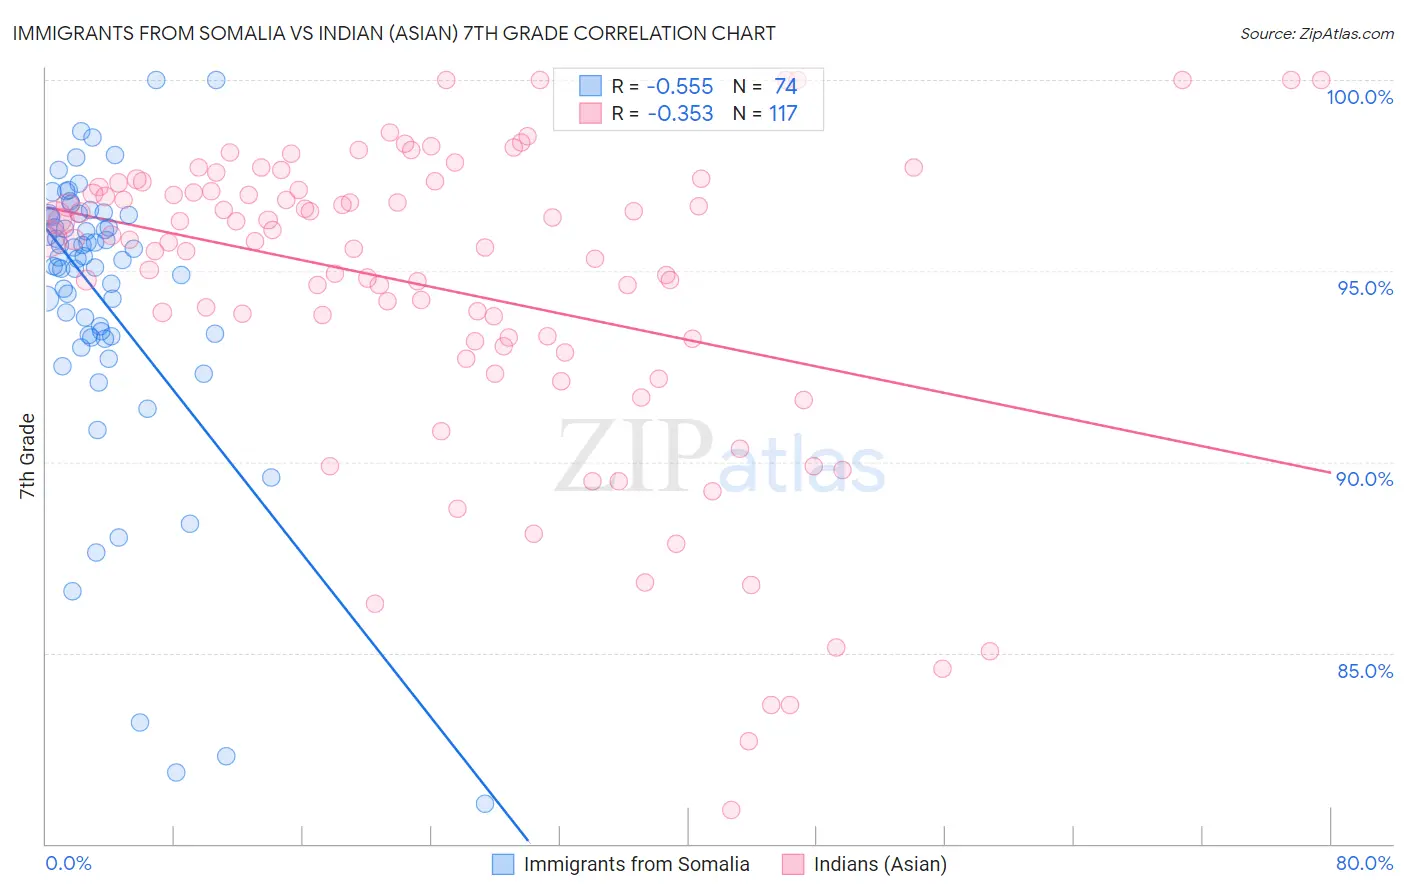
Immigrants from Somalia vs Indian (Asian) 7th Grade Correlation Chart
The statistical analysis conducted on geographies consisting of 92,098,504 people shows a substantial negative correlation between the proportion of Immigrants from Somalia and percentage of population with at least 7th grade education in the United States with a correlation coefficient (R) of -0.555 and weighted average of 95.2%. Similarly, the statistical analysis conducted on geographies consisting of 495,348,182 people shows a mild negative correlation between the proportion of Indians (Asian) and percentage of population with at least 7th grade education in the United States with a correlation coefficient (R) of -0.353 and weighted average of 95.5%, a difference of 0.25%.
7th Grade Correlation Summary
| Measurement | Immigrants from Somalia | Indian (Asian) |
| Minimum | 81.1% | 80.9% |
| Maximum | 100.0% | 100.0% |
| Range | 18.9% | 19.1% |
| Mean | 94.2% | 94.5% |
| Median | 95.3% | 95.8% |
| Interquartile 25% (IQ1) | 93.3% | 93.1% |
| Interquartile 75% (IQ3) | 96.4% | 97.2% |
| Interquartile Range (IQR) | 3.2% | 4.1% |
| Standard Deviation (Sample) | 3.9% | 4.1% |
| Standard Deviation (Population) | 3.9% | 4.1% |
Similar Demographics by 7th Grade
Demographics Similar to Immigrants from Somalia by 7th Grade
In terms of 7th grade, the demographic groups most similar to Immigrants from Somalia are South American (95.2%, a difference of 0.0%), West Indian (95.2%, a difference of 0.0%), Afghan (95.3%, a difference of 0.010%), Immigrants from Nigeria (95.2%, a difference of 0.010%), and Immigrants from Costa Rica (95.3%, a difference of 0.040%).
| Demographics | Rating | Rank | 7th Grade |
| Koreans | 0.8 /100 | #255 | Tragic 95.3% |
| Immigrants | China | 0.7 /100 | #256 | Tragic 95.3% |
| Immigrants | Congo | 0.7 /100 | #257 | Tragic 95.3% |
| Ghanaians | 0.7 /100 | #258 | Tragic 95.3% |
| Immigrants | Costa Rica | 0.6 /100 | #259 | Tragic 95.3% |
| Afghans | 0.5 /100 | #260 | Tragic 95.3% |
| South Americans | 0.5 /100 | #261 | Tragic 95.2% |
| Immigrants | Somalia | 0.5 /100 | #262 | Tragic 95.2% |
| West Indians | 0.5 /100 | #263 | Tragic 95.2% |
| Immigrants | Nigeria | 0.4 /100 | #264 | Tragic 95.2% |
| Immigrants | Uruguay | 0.3 /100 | #265 | Tragic 95.2% |
| Immigrants | Ghana | 0.3 /100 | #266 | Tragic 95.2% |
| Yuman | 0.3 /100 | #267 | Tragic 95.2% |
| Immigrants | Hong Kong | 0.3 /100 | #268 | Tragic 95.2% |
| Trinidadians and Tobagonians | 0.3 /100 | #269 | Tragic 95.2% |
Demographics Similar to Indians (Asian) by 7th Grade
In terms of 7th grade, the demographic groups most similar to Indians (Asian) are Immigrants from Asia (95.5%, a difference of 0.0%), Jamaican (95.5%, a difference of 0.010%), Asian (95.5%, a difference of 0.020%), Immigrants from Sierra Leone (95.5%, a difference of 0.020%), and South American Indian (95.5%, a difference of 0.020%).
| Demographics | Rating | Rank | 7th Grade |
| Senegalese | 4.0 /100 | #231 | Tragic 95.6% |
| Costa Ricans | 3.3 /100 | #232 | Tragic 95.5% |
| Immigrants | Indonesia | 3.3 /100 | #233 | Tragic 95.5% |
| Nigerians | 3.0 /100 | #234 | Tragic 95.5% |
| Immigrants | Africa | 2.7 /100 | #235 | Tragic 95.5% |
| Asians | 2.6 /100 | #236 | Tragic 95.5% |
| Immigrants | Asia | 2.3 /100 | #237 | Tragic 95.5% |
| Indians (Asian) | 2.3 /100 | #238 | Tragic 95.5% |
| Jamaicans | 2.2 /100 | #239 | Tragic 95.5% |
| Immigrants | Sierra Leone | 2.0 /100 | #240 | Tragic 95.5% |
| South American Indians | 2.0 /100 | #241 | Tragic 95.5% |
| Immigrants | Senegal | 1.9 /100 | #242 | Tragic 95.5% |
| U.S. Virgin Islanders | 1.6 /100 | #243 | Tragic 95.4% |
| Uruguayans | 1.6 /100 | #244 | Tragic 95.4% |
| Immigrants | Middle Africa | 1.5 /100 | #245 | Tragic 95.4% |