Immigrants from Somalia vs Immigrants from Philippines No Schooling Completed
COMPARE
Immigrants from Somalia
Immigrants from Philippines
No Schooling Completed
No Schooling Completed Comparison
Immigrants from Somalia
Immigrants from Philippines
3.0%
NO SCHOOLING COMPLETED
0.0/ 100
METRIC RATING
308th/ 347
METRIC RANK
2.6%
NO SCHOOLING COMPLETED
0.1/ 100
METRIC RATING
277th/ 347
METRIC RANK
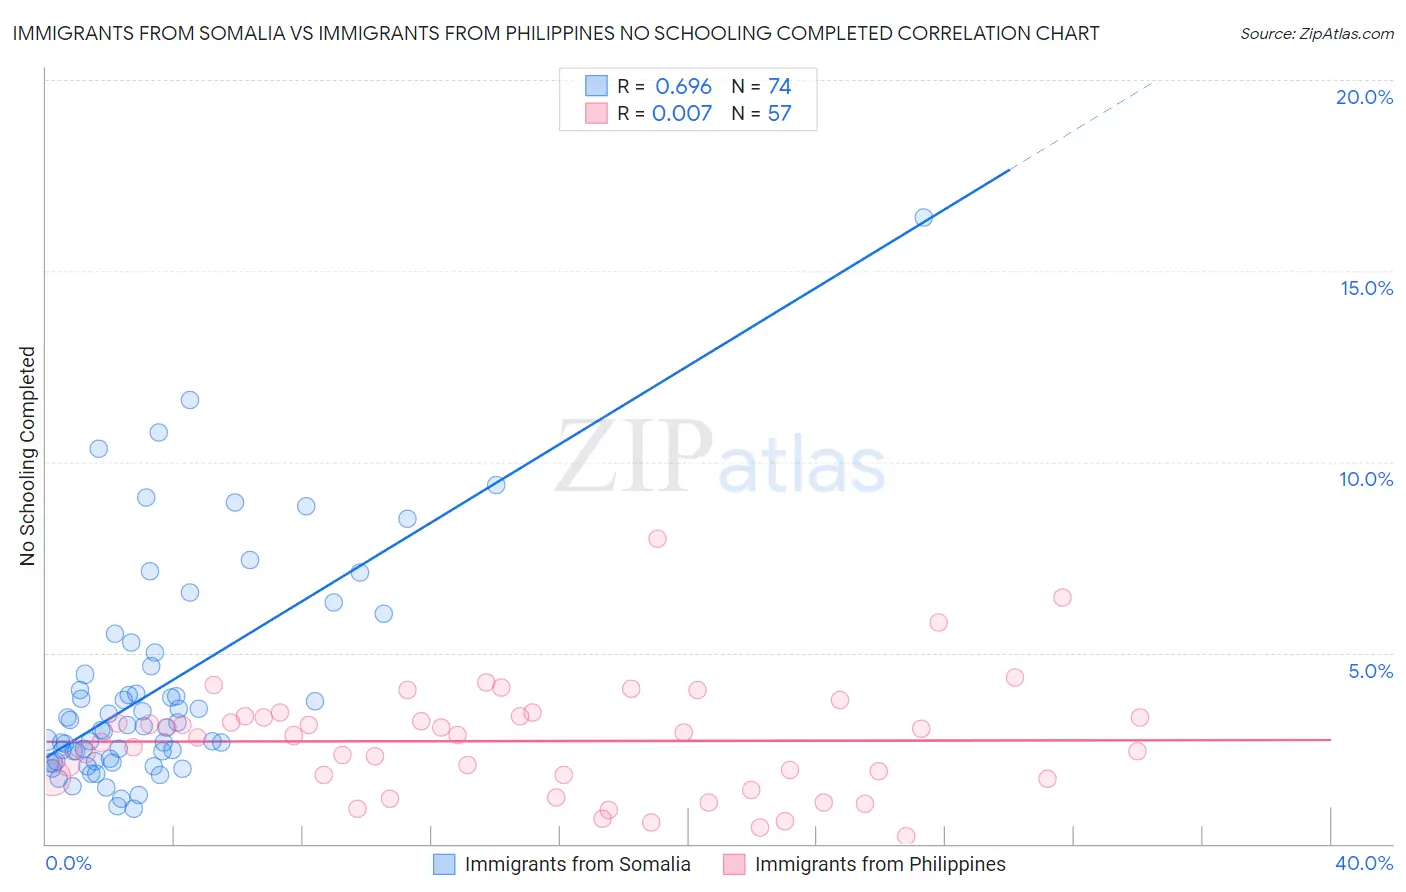
Immigrants from Somalia vs Immigrants from Philippines No Schooling Completed Correlation Chart
The statistical analysis conducted on geographies consisting of 92,035,757 people shows a significant positive correlation between the proportion of Immigrants from Somalia and percentage of population with no schooling in the United States with a correlation coefficient (R) of 0.696 and weighted average of 3.0%. Similarly, the statistical analysis conducted on geographies consisting of 465,179,873 people shows no correlation between the proportion of Immigrants from Philippines and percentage of population with no schooling in the United States with a correlation coefficient (R) of 0.007 and weighted average of 2.6%, a difference of 16.8%.
No Schooling Completed Correlation Summary
| Measurement | Immigrants from Somalia | Immigrants from Philippines |
| Minimum | 0.92% | 0.20% |
| Maximum | 16.4% | 8.0% |
| Range | 15.5% | 7.8% |
| Mean | 4.1% | 2.7% |
| Median | 3.0% | 2.8% |
| Interquartile 25% (IQ1) | 2.2% | 1.7% |
| Interquartile 75% (IQ3) | 4.6% | 3.3% |
| Interquartile Range (IQR) | 2.5% | 1.6% |
| Standard Deviation (Sample) | 2.9% | 1.5% |
| Standard Deviation (Population) | 2.9% | 1.5% |
Similar Demographics by No Schooling Completed
Demographics Similar to Immigrants from Somalia by No Schooling Completed
In terms of no schooling completed, the demographic groups most similar to Immigrants from Somalia are Immigrants from Haiti (3.0%, a difference of 0.16%), Belizean (3.0%, a difference of 0.24%), Hispanic or Latino (3.0%, a difference of 0.81%), Guyanese (3.0%, a difference of 0.86%), and Immigrants from the Azores (3.0%, a difference of 0.96%).
| Demographics | Rating | Rank | No Schooling Completed |
| Immigrants | South Eastern Asia | 0.0 /100 | #301 | Tragic 2.9% |
| Immigrants | Caribbean | 0.0 /100 | #302 | Tragic 2.9% |
| Somalis | 0.0 /100 | #303 | Tragic 2.9% |
| Nicaraguans | 0.0 /100 | #304 | Tragic 2.9% |
| Ecuadorians | 0.0 /100 | #305 | Tragic 3.0% |
| Belizeans | 0.0 /100 | #306 | Tragic 3.0% |
| Immigrants | Haiti | 0.0 /100 | #307 | Tragic 3.0% |
| Immigrants | Somalia | 0.0 /100 | #308 | Tragic 3.0% |
| Hispanics or Latinos | 0.0 /100 | #309 | Tragic 3.0% |
| Guyanese | 0.0 /100 | #310 | Tragic 3.0% |
| Immigrants | Azores | 0.0 /100 | #311 | Tragic 3.0% |
| Sri Lankans | 0.0 /100 | #312 | Tragic 3.0% |
| Hondurans | 0.0 /100 | #313 | Tragic 3.1% |
| Immigrants | Belize | 0.0 /100 | #314 | Tragic 3.1% |
| Immigrants | Nicaragua | 0.0 /100 | #315 | Tragic 3.1% |
Demographics Similar to Immigrants from Philippines by No Schooling Completed
In terms of no schooling completed, the demographic groups most similar to Immigrants from Philippines are Immigrants from Western Africa (2.6%, a difference of 0.050%), Immigrants from Uzbekistan (2.6%, a difference of 0.20%), Immigrants from China (2.6%, a difference of 0.61%), Barbadian (2.6%, a difference of 0.74%), and Trinidadian and Tobagonian (2.6%, a difference of 0.76%).
| Demographics | Rating | Rank | No Schooling Completed |
| Immigrants | Peru | 0.2 /100 | #270 | Tragic 2.5% |
| Cubans | 0.2 /100 | #271 | Tragic 2.5% |
| Immigrants | Bolivia | 0.2 /100 | #272 | Tragic 2.5% |
| Immigrants | Cameroon | 0.1 /100 | #273 | Tragic 2.5% |
| Ghanaians | 0.1 /100 | #274 | Tragic 2.6% |
| Immigrants | China | 0.1 /100 | #275 | Tragic 2.6% |
| Immigrants | Western Africa | 0.1 /100 | #276 | Tragic 2.6% |
| Immigrants | Philippines | 0.1 /100 | #277 | Tragic 2.6% |
| Immigrants | Uzbekistan | 0.1 /100 | #278 | Tragic 2.6% |
| Barbadians | 0.1 /100 | #279 | Tragic 2.6% |
| Trinidadians and Tobagonians | 0.1 /100 | #280 | Tragic 2.6% |
| Afghans | 0.1 /100 | #281 | Tragic 2.6% |
| Immigrants | Ghana | 0.1 /100 | #282 | Tragic 2.6% |
| Immigrants | Trinidad and Tobago | 0.0 /100 | #283 | Tragic 2.6% |
| Immigrants | West Indies | 0.0 /100 | #284 | Tragic 2.7% |