Immigrants from Singapore vs Nicaraguan 7th Grade
COMPARE
Immigrants from Singapore
Nicaraguan
7th Grade
7th Grade Comparison
Immigrants from Singapore
Nicaraguans
96.6%
7TH GRADE
98.3/ 100
METRIC RATING
103rd/ 347
METRIC RANK
93.5%
7TH GRADE
0.0/ 100
METRIC RATING
322nd/ 347
METRIC RANK
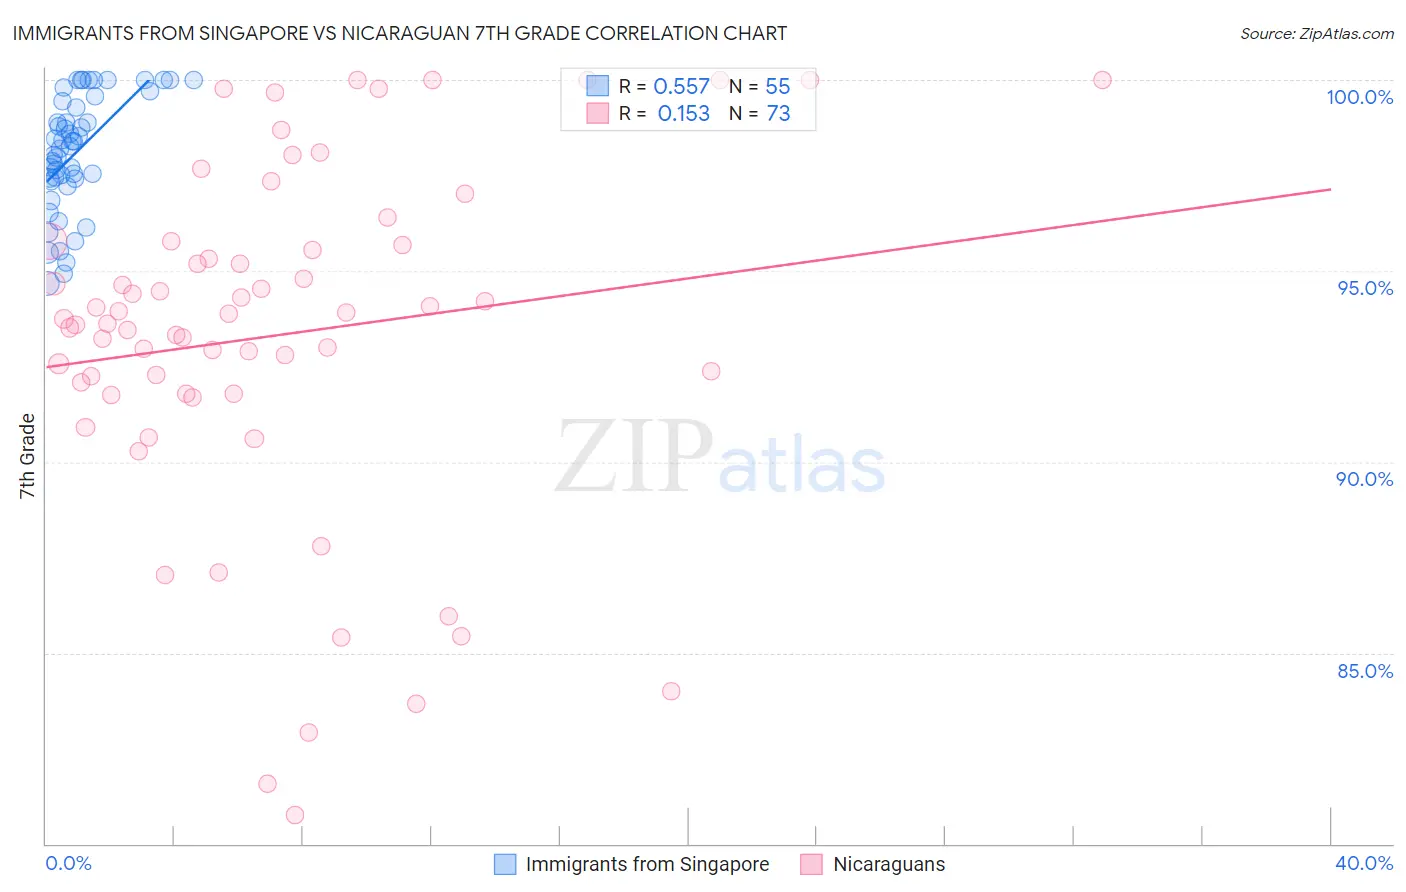
Immigrants from Singapore vs Nicaraguan 7th Grade Correlation Chart
The statistical analysis conducted on geographies consisting of 137,519,875 people shows a substantial positive correlation between the proportion of Immigrants from Singapore and percentage of population with at least 7th grade education in the United States with a correlation coefficient (R) of 0.557 and weighted average of 96.6%. Similarly, the statistical analysis conducted on geographies consisting of 285,711,651 people shows a poor positive correlation between the proportion of Nicaraguans and percentage of population with at least 7th grade education in the United States with a correlation coefficient (R) of 0.153 and weighted average of 93.5%, a difference of 3.4%.
7th Grade Correlation Summary
| Measurement | Immigrants from Singapore | Nicaraguan |
| Minimum | 94.7% | 80.8% |
| Maximum | 100.0% | 100.0% |
| Range | 5.3% | 19.2% |
| Mean | 98.1% | 93.3% |
| Median | 98.3% | 93.7% |
| Interquartile 25% (IQ1) | 97.4% | 91.8% |
| Interquartile 75% (IQ3) | 99.4% | 95.7% |
| Interquartile Range (IQR) | 2.0% | 3.9% |
| Standard Deviation (Sample) | 1.5% | 4.5% |
| Standard Deviation (Population) | 1.5% | 4.5% |
Similar Demographics by 7th Grade
Demographics Similar to Immigrants from Singapore by 7th Grade
In terms of 7th grade, the demographic groups most similar to Immigrants from Singapore are Immigrants from Czechoslovakia (96.6%, a difference of 0.0%), Shoshone (96.6%, a difference of 0.020%), South African (96.6%, a difference of 0.020%), German Russian (96.7%, a difference of 0.030%), and Thai (96.7%, a difference of 0.030%).
| Demographics | Rating | Rank | 7th Grade |
| Immigrants | Denmark | 98.7 /100 | #96 | Exceptional 96.7% |
| Immigrants | Germany | 98.7 /100 | #97 | Exceptional 96.7% |
| Immigrants | Sweden | 98.7 /100 | #98 | Exceptional 96.7% |
| Menominee | 98.7 /100 | #99 | Exceptional 96.7% |
| German Russians | 98.6 /100 | #100 | Exceptional 96.7% |
| Thais | 98.6 /100 | #101 | Exceptional 96.7% |
| Immigrants | Czechoslovakia | 98.3 /100 | #102 | Exceptional 96.6% |
| Immigrants | Singapore | 98.3 /100 | #103 | Exceptional 96.6% |
| Shoshone | 98.1 /100 | #104 | Exceptional 96.6% |
| South Africans | 98.0 /100 | #105 | Exceptional 96.6% |
| Iroquois | 97.9 /100 | #106 | Exceptional 96.6% |
| Lumbee | 97.8 /100 | #107 | Exceptional 96.6% |
| Immigrants | Saudi Arabia | 97.8 /100 | #108 | Exceptional 96.6% |
| Bhutanese | 97.7 /100 | #109 | Exceptional 96.6% |
| Okinawans | 97.4 /100 | #110 | Exceptional 96.6% |
Demographics Similar to Nicaraguans by 7th Grade
In terms of 7th grade, the demographic groups most similar to Nicaraguans are Belizean (93.5%, a difference of 0.040%), Immigrants from Fiji (93.5%, a difference of 0.080%), Immigrants from Belize (93.4%, a difference of 0.11%), Dominican (93.3%, a difference of 0.13%), and Central American Indian (93.3%, a difference of 0.20%).
| Demographics | Rating | Rank | 7th Grade |
| Vietnamese | 0.0 /100 | #315 | Tragic 93.9% |
| Immigrants | Vietnam | 0.0 /100 | #316 | Tragic 93.9% |
| Immigrants | Cuba | 0.0 /100 | #317 | Tragic 93.8% |
| Immigrants | Ecuador | 0.0 /100 | #318 | Tragic 93.7% |
| Immigrants | Cambodia | 0.0 /100 | #319 | Tragic 93.7% |
| Immigrants | Fiji | 0.0 /100 | #320 | Tragic 93.5% |
| Belizeans | 0.0 /100 | #321 | Tragic 93.5% |
| Nicaraguans | 0.0 /100 | #322 | Tragic 93.5% |
| Immigrants | Belize | 0.0 /100 | #323 | Tragic 93.4% |
| Dominicans | 0.0 /100 | #324 | Tragic 93.3% |
| Central American Indians | 0.0 /100 | #325 | Tragic 93.3% |
| Nepalese | 0.0 /100 | #326 | Tragic 93.2% |
| Immigrants | Cabo Verde | 0.0 /100 | #327 | Tragic 93.1% |
| Immigrants | Nicaragua | 0.0 /100 | #328 | Tragic 93.0% |
| Immigrants | Azores | 0.0 /100 | #329 | Tragic 93.0% |