Immigrants from Sierra Leone vs German Russian 4th Grade

COMPARE

Immigrants from Sierra Leone
Race
Ancestry
AfghanAfricanAlaska NativeAlaskan AthabascanAlbanianAleutAlsatianAmericanApacheArabArapahoArgentineanArmenianAssyrian/Chaldean/SyriacAustralianAustrianBahamianBangladeshiBarbadianBasqueBelgianBelizeanBermudanBhutaneseBlackfeetBolivianBrazilianBritishBritish West IndianBulgarianBurmeseCajunCambodianCanadianCape VerdeanCarpatho RusynCelticCentral AmericanCentral American IndianCherokeeCheyenneChickasawChileanChineseChippewaChoctawColombianColvilleComancheCosta RicanCreeCreekCroatianCrowCubanCypriotCzechCzechoslovakianDanishDelawareDominicanDutchDutch West IndianEastern EuropeanEcuadorianEgyptianEnglishEstonianEthiopianEuropeanFijianFilipinoFinnishFrenchFrench American IndianFrench CanadianGermanGhanaianGreekGuamanian/ChamorroGuatemalanGuyaneseHaitianHmongHonduranHopiHoumaHungarianIcelanderIndian (Asian)IndonesianInupiatIranianIraqiIrishIroquoisIsraeliItalianJamaicanJapaneseJordanianKenyanKiowaKoreanLaotianLatvianLebaneseLiberianLithuanianLumbeeLuxembourgerMacedonianMalaysianMalteseMarshalleseMenomineeMexicanMexican American IndianMongolianMoroccanNative HawaiianNavajoNepaleseNew ZealanderNicaraguanNigerianNorthern EuropeanNorwegianOkinawanOsageOttawaPaiutePakistaniPalestinianPanamanianParaguayanPennsylvania GermanPeruvianPimaPolishPortuguesePotawatomiPuebloPuerto RicanPuget Sound SalishRomanianRussianSalvadoranSamoanScandinavianScotch-IrishScottishSeminoleSenegaleseSerbianShoshoneSierra LeoneanSiouxSlavicSlovakSloveneSomaliSouth AfricanSouth AmericanSouth American IndianSoviet UnionSpaniardSpanishSpanish AmericanSpanish American IndianSri LankanSubsaharan AfricanSudaneseSwedishSwissSyrianTaiwaneseThaiTlingit-HaidaTohono O'OdhamTonganTrinidadian and TobagonianTsimshianTurkishU.S. Virgin IslanderUgandanUkrainianUruguayanUteVenezuelanVietnameseWelshWest IndianYakamaYaquiYugoslavianYumanYup'ikZimbabwean
Immigration
NonimmigrantsImmigrantsAfghanistanAfricaAlbaniaArgentinaArmeniaAsiaAustraliaAustriaBahamasBangladeshBarbadosBelarusBelgiumBelizeBoliviaBosnia and HerzegovinaBrazilBulgariaBurma/MyanmarCabo VerdeCambodiaCameroonCanadaCaribbeanCentral AmericaChileChinaColombiaCongoCosta RicaCroatiaCubaCzechoslovakiaDenmarkDominicaDominican RepublicEastern AfricaEastern AsiaEastern EuropeEcuadorEgyptEl SalvadorEnglandEritreaEthiopiaEuropeFijiFranceGermanyGhanaGreeceGrenadaGuatemalaGuyanaHaitiHondurasHong KongHungaryIndiaIndonesiaIranIraqIrelandIsraelItalyJamaicaJapanJordanKazakhstanKenyaKoreaKuwaitLaosLatin AmericaLatviaLebanonLiberiaLithuaniaMalaysiaMexicoMicronesiaMiddle AfricaMoldovaMoroccoNepalNetherlandsNicaraguaNigeriaNorth AmericaNorth MacedoniaNorthern AfricaNorthern EuropeNorwayOceaniaPakistanPanamaPeruPhilippinesPolandPortugalRomaniaRussiaSaudi ArabiaScotlandSenegalSerbiaSierra LeoneSingaporeSomaliaSouth AfricaSouth AmericaSouth Central AsiaSouth Eastern AsiaSouthern EuropeSpainSri LankaSt. Vincent and the GrenadinesSudanSwedenSwitzerlandSyriaTaiwanThailandTrinidad and TobagoTurkeyUgandaUkraineUruguayUzbekistanVenezuelaVietnamWest IndiesWestern AfricaWestern AsiaWestern EuropeYemenZaireZimbabweAzores
German Russian
Race
Ancestry
AfghanAfricanAlaska NativeAlaskan AthabascanAlbanianAleutAlsatianAmericanApacheArabArapahoArgentineanArmenianAssyrian/Chaldean/SyriacAustralianAustrianBahamianBangladeshiBarbadianBasqueBelgianBelizeanBermudanBhutaneseBlackfeetBolivianBrazilianBritishBritish West IndianBulgarianBurmeseCajunCambodianCanadianCape VerdeanCarpatho RusynCelticCentral AmericanCentral American IndianCherokeeCheyenneChickasawChileanChineseChippewaChoctawColombianColvilleComancheCosta RicanCreeCreekCroatianCrowCubanCypriotCzechCzechoslovakianDanishDelawareDominicanDutchDutch West IndianEastern EuropeanEcuadorianEgyptianEnglishEstonianEthiopianEuropeanFijianFilipinoFinnishFrenchFrench American IndianFrench CanadianGermanGerman RussianGhanaianGreekGuamanian/ChamorroGuatemalanGuyaneseHaitianHmongHonduranHopiHoumaHungarianIcelanderIndian (Asian)IndonesianInupiatIranianIraqiIrishIroquoisIsraeliItalianJamaicanJapaneseJordanianKenyanKiowaKoreanLaotianLatvianLebaneseLiberianLithuanianLumbeeLuxembourgerMacedonianMalaysianMalteseMarshalleseMenomineeMexicanMexican American IndianMongolianMoroccanNative HawaiianNavajoNepaleseNew ZealanderNicaraguanNigerianNorthern EuropeanNorwegianOkinawanOsageOttawaPaiutePakistaniPalestinianPanamanianParaguayanPennsylvania GermanPeruvianPimaPolishPortuguesePotawatomiPuebloPuerto RicanPuget Sound SalishRomanianRussianSalvadoranSamoanScandinavianScotch-IrishScottishSeminoleSenegaleseSerbianShoshoneSierra LeoneanSiouxSlavicSlovakSloveneSomaliSouth AfricanSouth AmericanSouth American IndianSoviet UnionSpaniardSpanishSpanish AmericanSpanish American IndianSri LankanSubsaharan AfricanSudaneseSwedishSwissSyrianTaiwaneseThaiTlingit-HaidaTohono O'OdhamTonganTrinidadian and TobagonianTsimshianTurkishU.S. Virgin IslanderUgandanUkrainianUruguayanUteVenezuelanVietnameseWelshWest IndianYakamaYaquiYugoslavianYumanYup'ikZimbabwean
Immigration
NonimmigrantsImmigrantsAfghanistanAfricaAlbaniaArgentinaArmeniaAsiaAustraliaAustriaBahamasBangladeshBarbadosBelarusBelgiumBelizeBoliviaBosnia and HerzegovinaBrazilBulgariaBurma/MyanmarCabo VerdeCambodiaCameroonCanadaCaribbeanCentral AmericaChileChinaColombiaCongoCosta RicaCroatiaCubaCzechoslovakiaDenmarkDominicaDominican RepublicEastern AfricaEastern AsiaEastern EuropeEcuadorEgyptEl SalvadorEnglandEritreaEthiopiaEuropeFijiFranceGermanyGhanaGreeceGrenadaGuatemalaGuyanaHaitiHondurasHong KongHungaryIndiaIndonesiaIranIraqIrelandIsraelItalyJamaicaJapanJordanKazakhstanKenyaKoreaKuwaitLaosLatin AmericaLatviaLebanonLiberiaLithuaniaMalaysiaMexicoMicronesiaMiddle AfricaMoldovaMoroccoNepalNetherlandsNicaraguaNigeriaNorth AmericaNorth MacedoniaNorthern AfricaNorthern EuropeNorwayOceaniaPakistanPanamaPeruPhilippinesPolandPortugalRomaniaRussiaSaudi ArabiaScotlandSenegalSerbiaSingaporeSomaliaSouth AfricaSouth AmericaSouth Central AsiaSouth Eastern AsiaSouthern EuropeSpainSri LankaSt. Vincent and the GrenadinesSudanSwedenSwitzerlandSyriaTaiwanThailandTrinidad and TobagoTurkeyUgandaUkraineUruguayUzbekistanVenezuelaVietnamWest IndiesWestern AfricaWestern AsiaWestern EuropeYemenZaireZimbabweAzores
4th Grade
Income
Poverty
Unemployment
Labor Participation
Family Structure
Vehicle Availability
Education Level
Disability

4th Grade Comparison

Immigrants from Sierra Leone

German Russians

Tragic
Exceptional
97.0%
4TH GRADE
0.4/ 100
METRIC RATING
260th/ 347
METRIC RANK
97.9%
4TH GRADE
97.5/ 100
METRIC RATING
105th/ 347
METRIC RANK

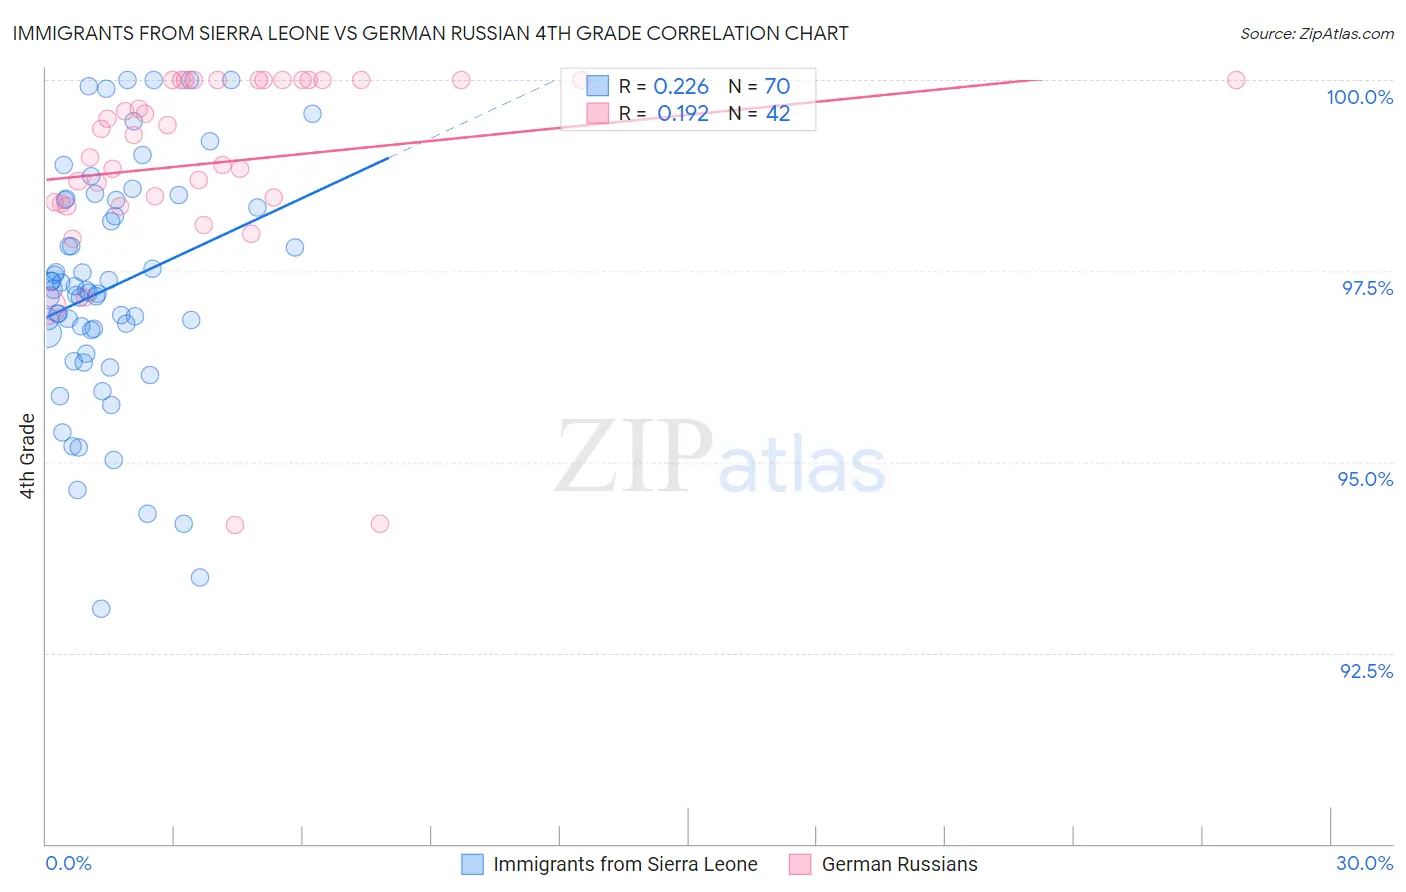
Immigrants from Sierra Leone vs German Russian 4th Grade Correlation Chart

The statistical analysis conducted on geographies consisting of 101,634,956 people shows a weak positive correlation between the proportion of Immigrants from Sierra Leone and percentage of population with at least 4th grade education in the United States with a correlation coefficient (R) of 0.226 and weighted average of 97.0%. Similarly, the statistical analysis conducted on geographies consisting of 96,461,520 people shows a poor positive correlation between the proportion of German Russians and percentage of population with at least 4th grade education in the United States with a correlation coefficient (R) of 0.192 and weighted average of 97.9%, a difference of 0.87%.
Immigrants from Sierra Leone vs German Russian 4th Grade

4th Grade Correlation Summary

MeasurementImmigrants from Sierra LeoneGerman Russian
Minimum93.1%94.2%
Maximum100.0%100.0%
Range6.9%5.8%
Mean97.3%98.9%
Median97.2%99.3%
Interquartile 25% (IQ1)96.7%98.4%
Interquartile 75% (IQ3)98.4%100.0%
Interquartile Range (IQR)1.7%1.6%
Standard Deviation (Sample)1.5%1.4%
Standard Deviation (Population)1.5%1.3%

Similar Demographics by 4th Grade

Demographics Similar to Immigrants from Sierra Leone by 4th Grade

In terms of 4th grade, the demographic groups most similar to Immigrants from Sierra Leone are Immigrants from South America (97.0%, a difference of 0.0%), Immigrants from Ethiopia (97.0%, a difference of 0.010%), West Indian (97.0%, a difference of 0.010%), Immigrants from Jamaica (97.0%, a difference of 0.010%), and Immigrants from Congo (97.0%, a difference of 0.020%).
DemographicsRating | Rank4th Grade
Immigrants | Liberia
0.8
/100
|
#253
Tragic
97.1%
Immigrants | Middle Africa
0.8
/100
|
#254
Tragic
97.1%
Peruvians
0.7
/100
|
#255
Tragic
97.1%
Bolivians
0.7
/100
|
#256
Tragic
97.1%
Immigrants | Congo
0.5
/100
|
#257
Tragic
97.0%
Immigrants | Colombia
0.5
/100
|
#258
Tragic
97.0%
Immigrants | Ethiopia
0.4
/100
|
#259
Tragic
97.0%
Immigrants | Sierra Leone
0.4
/100
|
#260
Tragic
97.0%
Immigrants | South America
0.4
/100
|
#261
Tragic
97.0%
West Indians
0.4
/100
|
#262
Tragic
97.0%
Immigrants | Jamaica
0.3
/100
|
#263
Tragic
97.0%
Taiwanese
0.3
/100
|
#264
Tragic
97.0%
Armenians
0.3
/100
|
#265
Tragic
97.0%
Immigrants | China
0.3
/100
|
#266
Tragic
97.0%
Immigrants | Nigeria
0.3
/100
|
#267
Tragic
97.0%

Demographics Similar to German Russians by 4th Grade

In terms of 4th grade, the demographic groups most similar to German Russians are Nonimmigrants (97.9%, a difference of 0.0%), Immigrants from Czechoslovakia (97.9%, a difference of 0.0%), Puget Sound Salish (97.9%, a difference of 0.010%), Bhutanese (97.9%, a difference of 0.010%), and Immigrants from Singapore (97.9%, a difference of 0.010%).
DemographicsRating | Rank4th Grade
South Africans
98.2
/100
|
#98
Exceptional
97.9%
Turks
98.2
/100
|
#99
Exceptional
97.9%
Yugoslavians
98.1
/100
|
#100
Exceptional
97.9%
Cree
98.1
/100
|
#101
Exceptional
97.9%
Choctaw
97.9
/100
|
#102
Exceptional
97.9%
Puget Sound Salish
97.7
/100
|
#103
Exceptional
97.9%
Immigrants | Nonimmigrants
97.5
/100
|
#104
Exceptional
97.9%
German Russians
97.5
/100
|
#105
Exceptional
97.9%
Immigrants | Czechoslovakia
97.5
/100
|
#106
Exceptional
97.9%
Bhutanese
97.4
/100
|
#107
Exceptional
97.9%
Immigrants | Singapore
97.3
/100
|
#108
Exceptional
97.9%
Immigrants | Latvia
96.8
/100
|
#109
Exceptional
97.8%
Thais
96.7
/100
|
#110
Exceptional
97.8%
Immigrants | Switzerland
96.1
/100
|
#111
Exceptional
97.8%
Okinawans
96.0
/100
|
#112
Exceptional
97.8%