Immigrants from Sierra Leone vs Cypriot 11th Grade
COMPARE
Immigrants from Sierra Leone
Cypriot
11th Grade
11th Grade Comparison
Immigrants from Sierra Leone
Cypriots
92.0%
11TH GRADE
11.1/ 100
METRIC RATING
217th/ 347
METRIC RANK
94.1%
11TH GRADE
99.9/ 100
METRIC RATING
41st/ 347
METRIC RANK
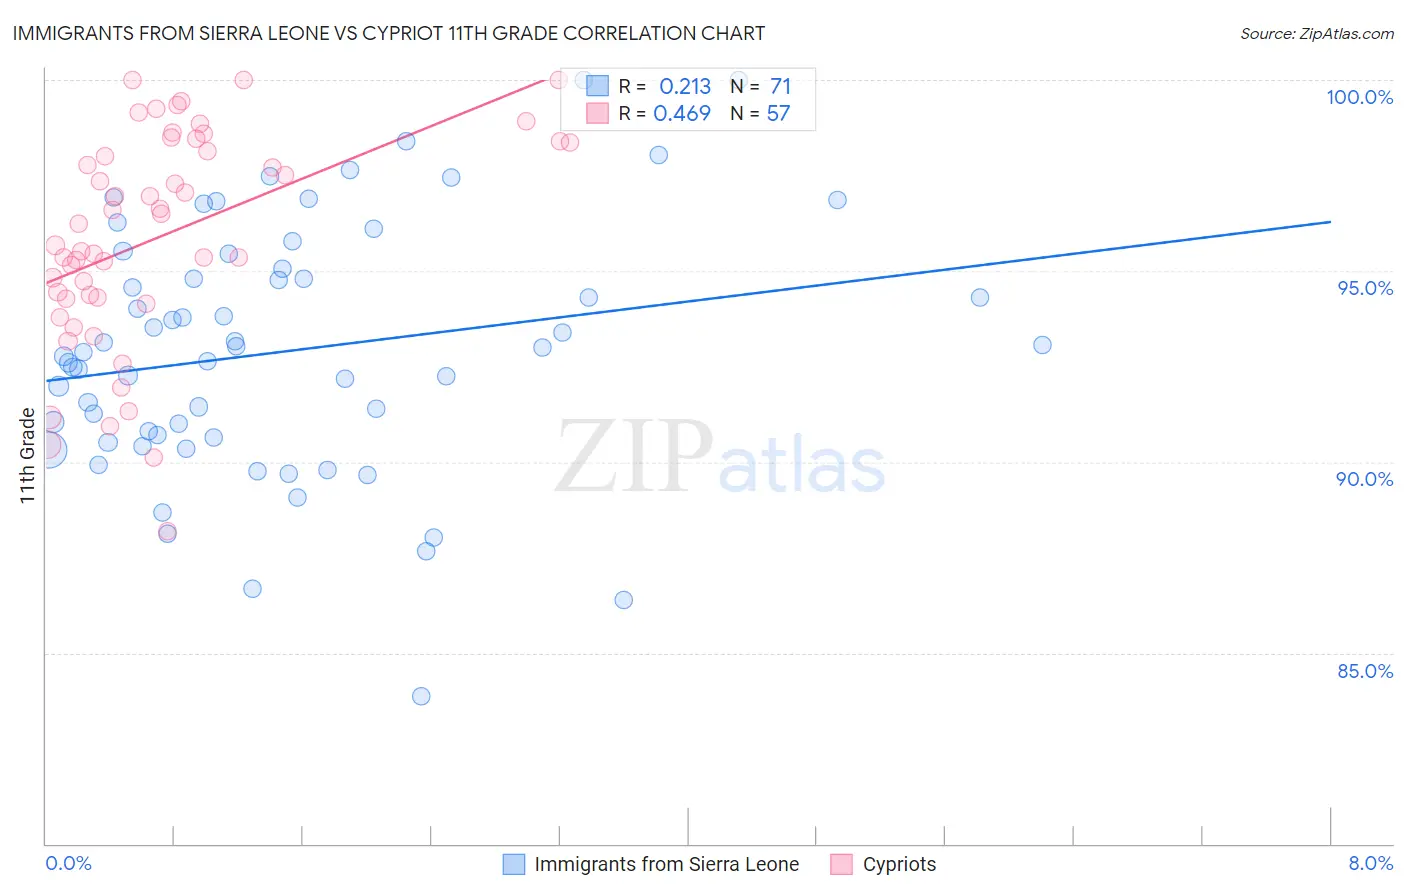
Immigrants from Sierra Leone vs Cypriot 11th Grade Correlation Chart
The statistical analysis conducted on geographies consisting of 101,654,421 people shows a weak positive correlation between the proportion of Immigrants from Sierra Leone and percentage of population with at least 11th grade education in the United States with a correlation coefficient (R) of 0.213 and weighted average of 92.0%. Similarly, the statistical analysis conducted on geographies consisting of 61,870,289 people shows a moderate positive correlation between the proportion of Cypriots and percentage of population with at least 11th grade education in the United States with a correlation coefficient (R) of 0.469 and weighted average of 94.1%, a difference of 2.2%.
11th Grade Correlation Summary
| Measurement | Immigrants from Sierra Leone | Cypriot |
| Minimum | 83.9% | 88.2% |
| Maximum | 100.0% | 100.0% |
| Range | 16.1% | 11.8% |
| Mean | 92.9% | 95.9% |
| Median | 92.9% | 96.2% |
| Interquartile 25% (IQ1) | 90.6% | 94.3% |
| Interquartile 75% (IQ3) | 95.0% | 98.4% |
| Interquartile Range (IQR) | 4.4% | 4.1% |
| Standard Deviation (Sample) | 3.3% | 2.8% |
| Standard Deviation (Population) | 3.2% | 2.8% |
Similar Demographics by 11th Grade
Demographics Similar to Immigrants from Sierra Leone by 11th Grade
In terms of 11th grade, the demographic groups most similar to Immigrants from Sierra Leone are Somali (92.1%, a difference of 0.010%), Immigrants from Southern Europe (92.1%, a difference of 0.030%), Blackfeet (92.0%, a difference of 0.030%), Portuguese (92.0%, a difference of 0.030%), and Afghan (92.1%, a difference of 0.040%).
| Demographics | Rating | Rank | 11th Grade |
| Ethiopians | 18.8 /100 | #210 | Poor 92.2% |
| Immigrants | Micronesia | 17.7 /100 | #211 | Poor 92.2% |
| Koreans | 14.4 /100 | #212 | Poor 92.1% |
| Immigrants | Ethiopia | 13.9 /100 | #213 | Poor 92.1% |
| Afghans | 12.8 /100 | #214 | Poor 92.1% |
| Immigrants | Southern Europe | 12.5 /100 | #215 | Poor 92.1% |
| Somalis | 11.6 /100 | #216 | Poor 92.1% |
| Immigrants | Sierra Leone | 11.1 /100 | #217 | Poor 92.0% |
| Blackfeet | 10.1 /100 | #218 | Poor 92.0% |
| Portuguese | 10.0 /100 | #219 | Tragic 92.0% |
| South American Indians | 7.6 /100 | #220 | Tragic 92.0% |
| Immigrants | Liberia | 7.0 /100 | #221 | Tragic 91.9% |
| Immigrants | Africa | 6.5 /100 | #222 | Tragic 91.9% |
| Immigrants | Bahamas | 6.5 /100 | #223 | Tragic 91.9% |
| Costa Ricans | 6.3 /100 | #224 | Tragic 91.9% |
Demographics Similar to Cypriots by 11th Grade
In terms of 11th grade, the demographic groups most similar to Cypriots are Immigrants from Lithuania (94.1%, a difference of 0.010%), Thai (94.1%, a difference of 0.010%), Immigrants from Austria (94.1%, a difference of 0.010%), Greek (94.1%, a difference of 0.010%), and Immigrants from Ireland (94.1%, a difference of 0.020%).
| Demographics | Rating | Rank | 11th Grade |
| Immigrants | Scotland | 99.9 /100 | #34 | Exceptional 94.2% |
| Immigrants | Singapore | 99.9 /100 | #35 | Exceptional 94.2% |
| Immigrants | Northern Europe | 99.9 /100 | #36 | Exceptional 94.2% |
| Northern Europeans | 99.9 /100 | #37 | Exceptional 94.2% |
| Hungarians | 99.9 /100 | #38 | Exceptional 94.2% |
| Immigrants | Lithuania | 99.9 /100 | #39 | Exceptional 94.1% |
| Thais | 99.9 /100 | #40 | Exceptional 94.1% |
| Cypriots | 99.9 /100 | #41 | Exceptional 94.1% |
| Immigrants | Austria | 99.9 /100 | #42 | Exceptional 94.1% |
| Greeks | 99.9 /100 | #43 | Exceptional 94.1% |
| Immigrants | Ireland | 99.9 /100 | #44 | Exceptional 94.1% |
| Australians | 99.9 /100 | #45 | Exceptional 94.1% |
| Serbians | 99.9 /100 | #46 | Exceptional 94.1% |
| Filipinos | 99.9 /100 | #47 | Exceptional 94.1% |
| Macedonians | 99.9 /100 | #48 | Exceptional 94.1% |