Immigrants from Sierra Leone vs Afghan 8th Grade
COMPARE
Immigrants from Sierra Leone
Afghan
8th Grade
8th Grade Comparison
Immigrants from Sierra Leone
Afghans
95.1%
8TH GRADE
2.1/ 100
METRIC RATING
239th/ 347
METRIC RANK
94.9%
8TH GRADE
0.6/ 100
METRIC RATING
257th/ 347
METRIC RANK
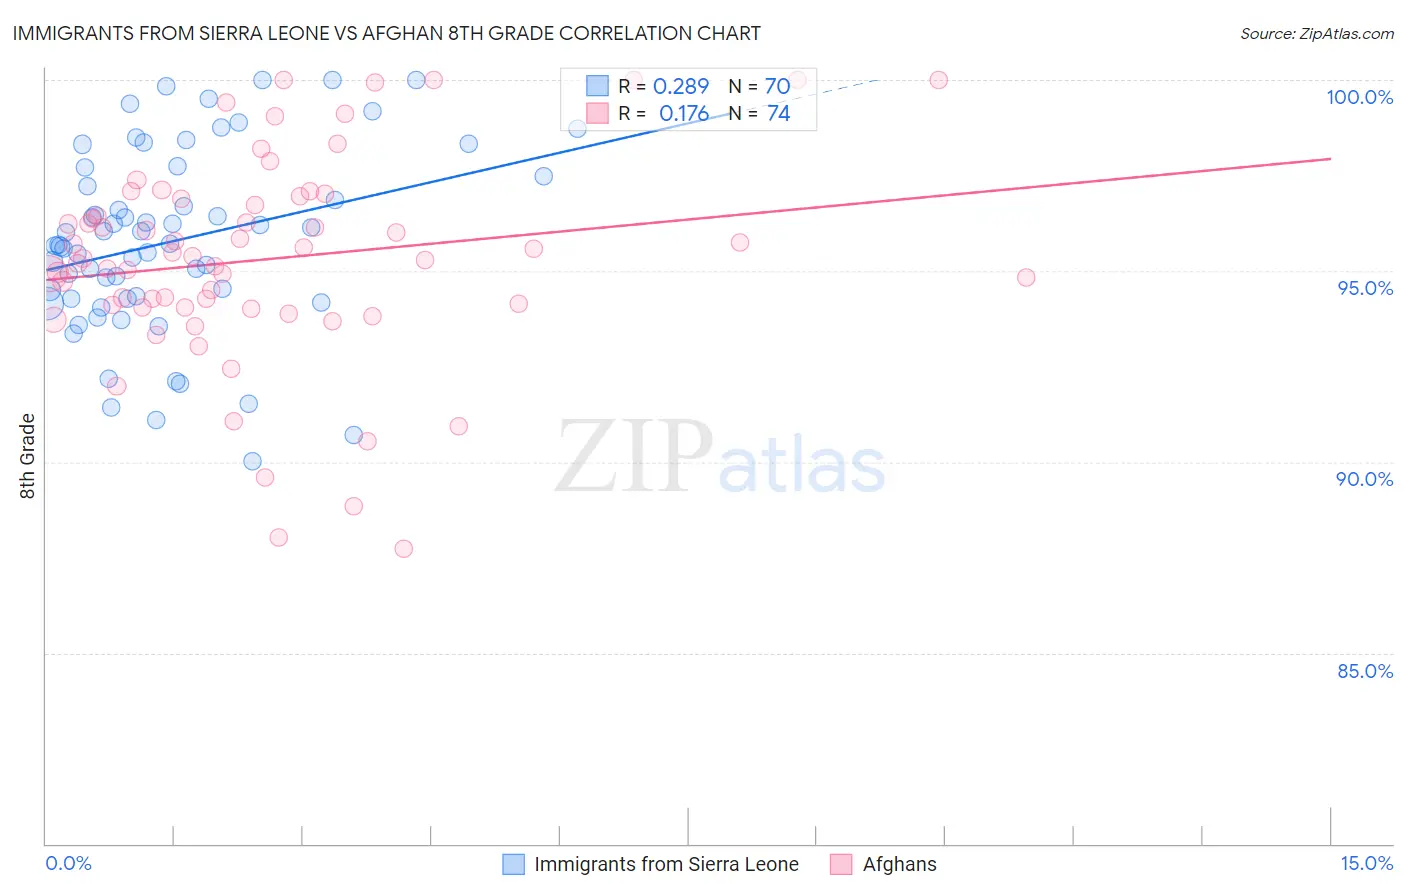
Immigrants from Sierra Leone vs Afghan 8th Grade Correlation Chart
The statistical analysis conducted on geographies consisting of 101,634,956 people shows a weak positive correlation between the proportion of Immigrants from Sierra Leone and percentage of population with at least 8th grade education in the United States with a correlation coefficient (R) of 0.289 and weighted average of 95.1%. Similarly, the statistical analysis conducted on geographies consisting of 148,851,685 people shows a poor positive correlation between the proportion of Afghans and percentage of population with at least 8th grade education in the United States with a correlation coefficient (R) of 0.176 and weighted average of 94.9%, a difference of 0.20%.
8th Grade Correlation Summary
| Measurement | Immigrants from Sierra Leone | Afghan |
| Minimum | 90.0% | 87.7% |
| Maximum | 100.0% | 100.0% |
| Range | 10.0% | 12.3% |
| Mean | 95.8% | 95.3% |
| Median | 95.7% | 95.3% |
| Interquartile 25% (IQ1) | 94.3% | 94.1% |
| Interquartile 75% (IQ3) | 97.5% | 96.9% |
| Interquartile Range (IQR) | 3.2% | 2.8% |
| Standard Deviation (Sample) | 2.4% | 2.7% |
| Standard Deviation (Population) | 2.4% | 2.7% |
Demographics Similar to Immigrants from Sierra Leone and Afghans by 8th Grade
In terms of 8th grade, the demographic groups most similar to Immigrants from Sierra Leone are Ethiopian (95.1%, a difference of 0.0%), South American Indian (95.1%, a difference of 0.010%), Native/Alaskan (95.2%, a difference of 0.020%), Tongan (95.1%, a difference of 0.030%), and Paiute (95.1%, a difference of 0.030%). Similarly, the demographic groups most similar to Afghans are Colombian (95.0%, a difference of 0.010%), Immigrants from Congo (94.9%, a difference of 0.010%), Immigrants from Somalia (95.0%, a difference of 0.020%), Immigrants from Cameroon (95.0%, a difference of 0.040%), and U.S. Virgin Islander (95.0%, a difference of 0.060%).
| Demographics | Rating | Rank | 8th Grade |
| Natives/Alaskans | 2.3 /100 | #238 | Tragic 95.2% |
| Immigrants | Sierra Leone | 2.1 /100 | #239 | Tragic 95.1% |
| Ethiopians | 2.0 /100 | #240 | Tragic 95.1% |
| South American Indians | 1.9 /100 | #241 | Tragic 95.1% |
| Tongans | 1.7 /100 | #242 | Tragic 95.1% |
| Paiute | 1.7 /100 | #243 | Tragic 95.1% |
| Immigrants | Middle Africa | 1.7 /100 | #244 | Tragic 95.1% |
| Jamaicans | 1.4 /100 | #245 | Tragic 95.1% |
| Somalis | 1.4 /100 | #246 | Tragic 95.1% |
| Immigrants | Senegal | 1.4 /100 | #247 | Tragic 95.1% |
| Uruguayans | 1.2 /100 | #248 | Tragic 95.1% |
| Immigrants | China | 1.1 /100 | #249 | Tragic 95.0% |
| Koreans | 1.1 /100 | #250 | Tragic 95.0% |
| Bolivians | 1.0 /100 | #251 | Tragic 95.0% |
| Immigrants | Ethiopia | 1.0 /100 | #252 | Tragic 95.0% |
| U.S. Virgin Islanders | 0.9 /100 | #253 | Tragic 95.0% |
| Immigrants | Cameroon | 0.8 /100 | #254 | Tragic 95.0% |
| Immigrants | Somalia | 0.7 /100 | #255 | Tragic 95.0% |
| Colombians | 0.7 /100 | #256 | Tragic 95.0% |
| Afghans | 0.6 /100 | #257 | Tragic 94.9% |
| Immigrants | Congo | 0.6 /100 | #258 | Tragic 94.9% |