Immigrants from Senegal vs Scotch-Irish 6th Grade
COMPARE
Immigrants from Senegal
Scotch-Irish
6th Grade
6th Grade Comparison
Immigrants from Senegal
Scotch-Irish
96.5%
6TH GRADE
0.7/ 100
METRIC RATING
251st/ 347
METRIC RANK
98.0%
6TH GRADE
100.0/ 100
METRIC RATING
25th/ 347
METRIC RANK
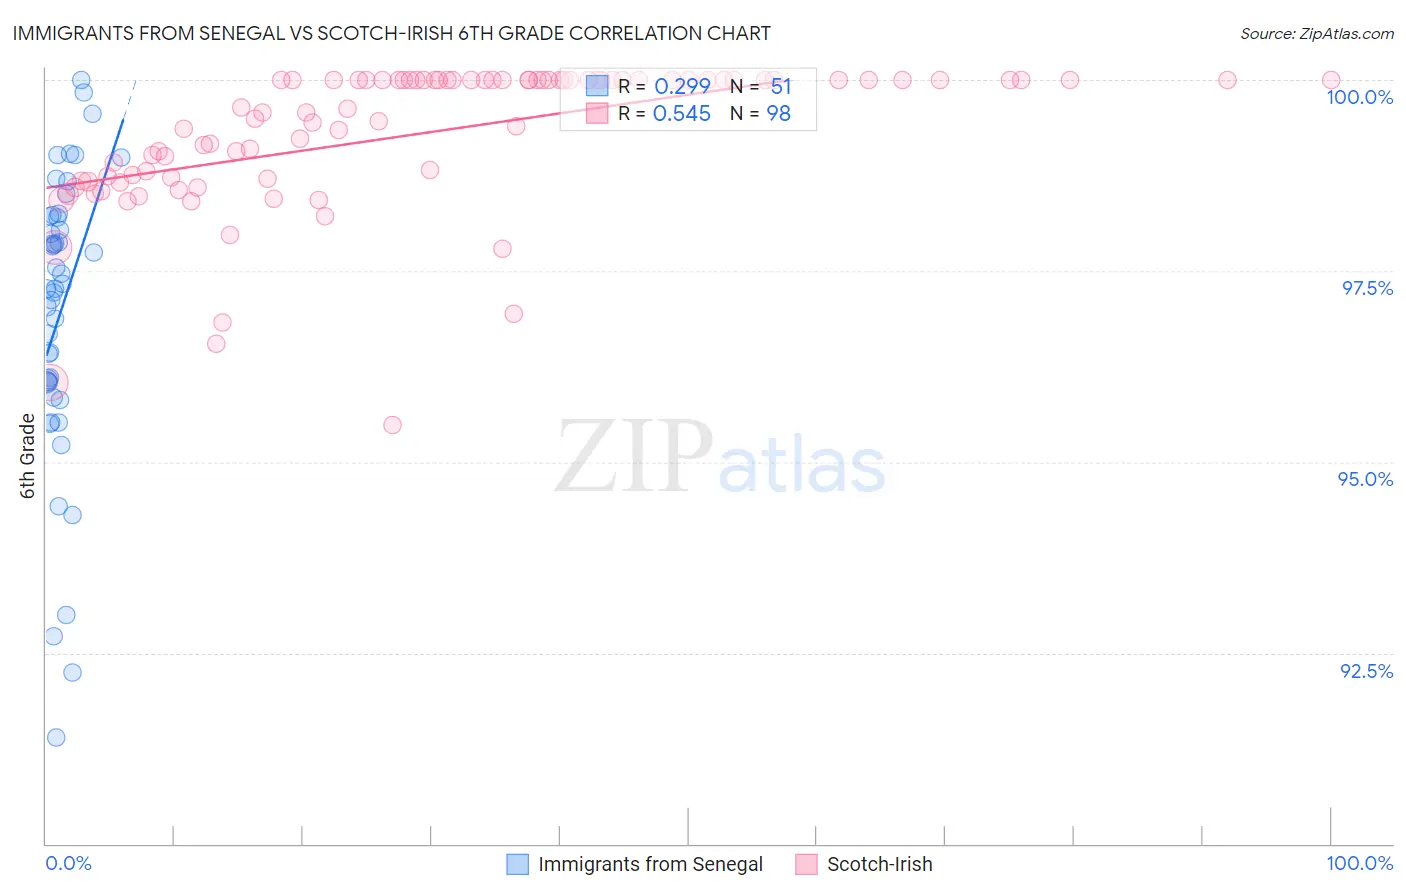
Immigrants from Senegal vs Scotch-Irish 6th Grade Correlation Chart
The statistical analysis conducted on geographies consisting of 90,119,306 people shows a weak positive correlation between the proportion of Immigrants from Senegal and percentage of population with at least 6th grade education in the United States with a correlation coefficient (R) of 0.299 and weighted average of 96.5%. Similarly, the statistical analysis conducted on geographies consisting of 548,777,407 people shows a substantial positive correlation between the proportion of Scotch-Irish and percentage of population with at least 6th grade education in the United States with a correlation coefficient (R) of 0.545 and weighted average of 98.0%, a difference of 1.6%.
6th Grade Correlation Summary
| Measurement | Immigrants from Senegal | Scotch-Irish |
| Minimum | 91.4% | 95.5% |
| Maximum | 100.0% | 100.0% |
| Range | 8.6% | 4.5% |
| Mean | 96.9% | 99.3% |
| Median | 97.3% | 99.8% |
| Interquartile 25% (IQ1) | 96.0% | 98.7% |
| Interquartile 75% (IQ3) | 98.2% | 100.0% |
| Interquartile Range (IQR) | 2.2% | 1.3% |
| Standard Deviation (Sample) | 1.9% | 0.95% |
| Standard Deviation (Population) | 1.9% | 0.95% |
Similar Demographics by 6th Grade
Demographics Similar to Immigrants from Senegal by 6th Grade
In terms of 6th grade, the demographic groups most similar to Immigrants from Senegal are Immigrants from Uruguay (96.5%, a difference of 0.010%), Jamaican (96.5%, a difference of 0.010%), Immigrants from Middle Africa (96.5%, a difference of 0.020%), Immigrants from Ethiopia (96.5%, a difference of 0.020%), and Immigrants from Congo (96.5%, a difference of 0.020%).
| Demographics | Rating | Rank | 6th Grade |
| Ethiopians | 1.5 /100 | #244 | Tragic 96.6% |
| Immigrants | Costa Rica | 1.3 /100 | #245 | Tragic 96.6% |
| Immigrants | Africa | 1.3 /100 | #246 | Tragic 96.6% |
| Bolivians | 1.0 /100 | #247 | Tragic 96.5% |
| Tohono O'odham | 1.0 /100 | #248 | Tragic 96.5% |
| Colombians | 0.9 /100 | #249 | Tragic 96.5% |
| Immigrants | Middle Africa | 0.8 /100 | #250 | Tragic 96.5% |
| Immigrants | Senegal | 0.7 /100 | #251 | Tragic 96.5% |
| Immigrants | Uruguay | 0.6 /100 | #252 | Tragic 96.5% |
| Jamaicans | 0.6 /100 | #253 | Tragic 96.5% |
| Immigrants | Ethiopia | 0.6 /100 | #254 | Tragic 96.5% |
| Immigrants | Congo | 0.6 /100 | #255 | Tragic 96.5% |
| U.S. Virgin Islanders | 0.5 /100 | #256 | Tragic 96.5% |
| Taiwanese | 0.5 /100 | #257 | Tragic 96.5% |
| Immigrants | China | 0.4 /100 | #258 | Tragic 96.4% |
Demographics Similar to Scotch-Irish by 6th Grade
In terms of 6th grade, the demographic groups most similar to Scotch-Irish are Sioux (98.0%, a difference of 0.010%), Croatian (98.0%, a difference of 0.010%), Czech (98.0%, a difference of 0.010%), Danish (98.0%, a difference of 0.020%), and Yup'ik (98.0%, a difference of 0.020%).
| Demographics | Rating | Rank | 6th Grade |
| Pennsylvania Germans | 100.0 /100 | #18 | Exceptional 98.1% |
| Irish | 100.0 /100 | #19 | Exceptional 98.1% |
| Finns | 100.0 /100 | #20 | Exceptional 98.1% |
| Lithuanians | 100.0 /100 | #21 | Exceptional 98.1% |
| Danes | 100.0 /100 | #22 | Exceptional 98.0% |
| Sioux | 100.0 /100 | #23 | Exceptional 98.0% |
| Croatians | 100.0 /100 | #24 | Exceptional 98.0% |
| Scotch-Irish | 100.0 /100 | #25 | Exceptional 98.0% |
| Czechs | 100.0 /100 | #26 | Exceptional 98.0% |
| Yup'ik | 100.0 /100 | #27 | Exceptional 98.0% |
| Scandinavians | 100.0 /100 | #28 | Exceptional 98.0% |
| French | 100.0 /100 | #29 | Exceptional 98.0% |
| French Canadians | 100.0 /100 | #30 | Exceptional 98.0% |
| Europeans | 100.0 /100 | #31 | Exceptional 98.0% |
| Alaska Natives | 100.0 /100 | #32 | Exceptional 98.0% |