Immigrants from Scotland vs Subsaharan African Professional Degree
COMPARE
Immigrants from Scotland
Subsaharan African
Professional Degree
Professional Degree Comparison
Immigrants from Scotland
Sub-Saharan Africans
5.3%
PROFESSIONAL DEGREE
99.5/ 100
METRIC RATING
90th/ 347
METRIC RANK
4.1%
PROFESSIONAL DEGREE
12.8/ 100
METRIC RATING
207th/ 347
METRIC RANK
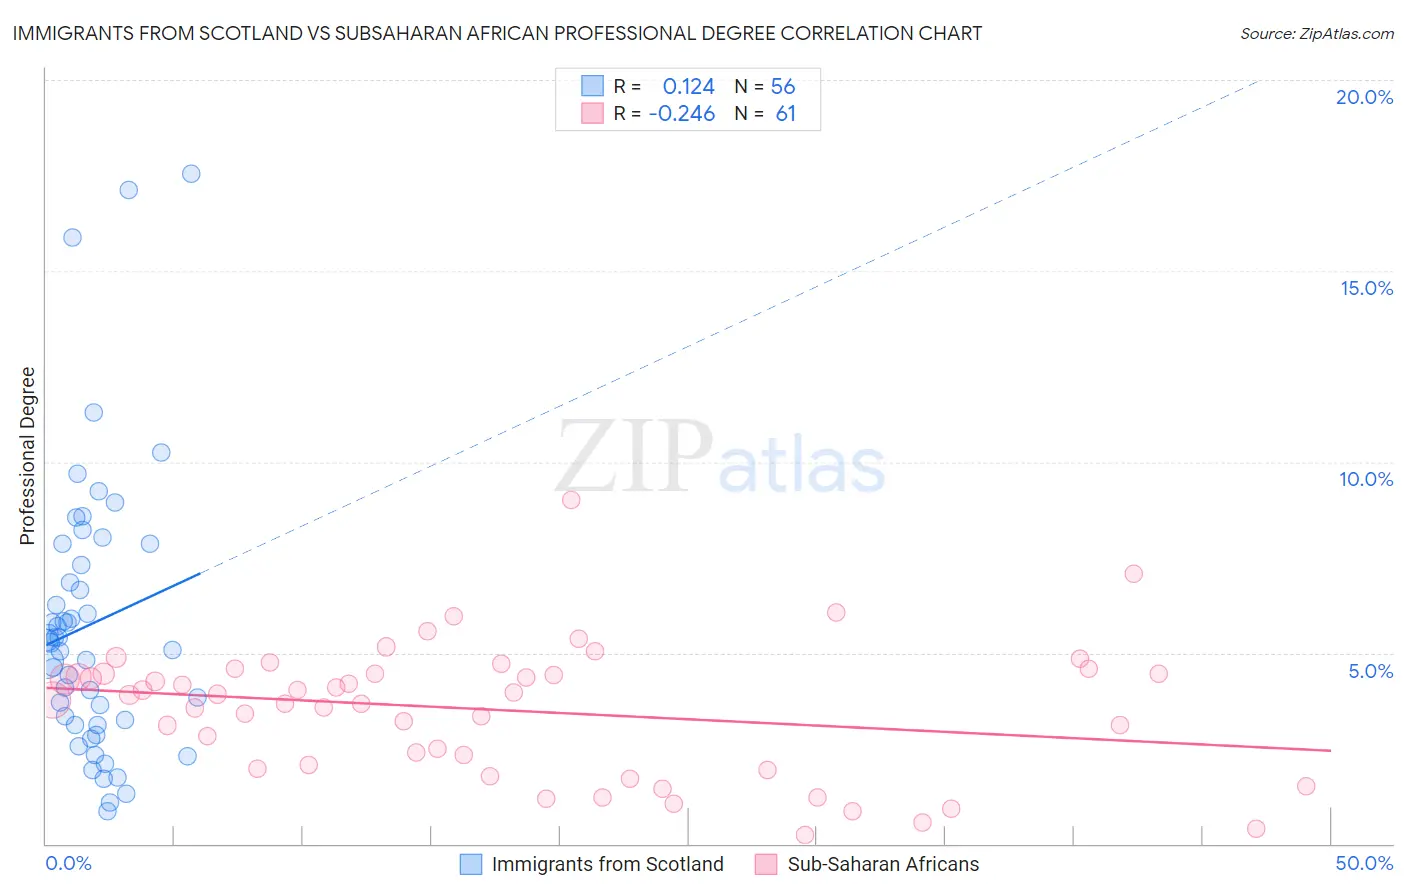
Immigrants from Scotland vs Subsaharan African Professional Degree Correlation Chart
The statistical analysis conducted on geographies consisting of 196,234,125 people shows a poor positive correlation between the proportion of Immigrants from Scotland and percentage of population with at least professional degree education in the United States with a correlation coefficient (R) of 0.124 and weighted average of 5.3%. Similarly, the statistical analysis conducted on geographies consisting of 505,148,465 people shows a weak negative correlation between the proportion of Sub-Saharan Africans and percentage of population with at least professional degree education in the United States with a correlation coefficient (R) of -0.246 and weighted average of 4.1%, a difference of 28.1%.
Professional Degree Correlation Summary
| Measurement | Immigrants from Scotland | Subsaharan African |
| Minimum | 0.84% | 0.23% |
| Maximum | 17.6% | 9.0% |
| Range | 16.7% | 8.8% |
| Mean | 5.8% | 3.5% |
| Median | 5.3% | 3.9% |
| Interquartile 25% (IQ1) | 3.2% | 2.0% |
| Interquartile 75% (IQ3) | 7.6% | 4.4% |
| Interquartile Range (IQR) | 4.4% | 2.4% |
| Standard Deviation (Sample) | 3.6% | 1.7% |
| Standard Deviation (Population) | 3.6% | 1.7% |
Similar Demographics by Professional Degree
Demographics Similar to Immigrants from Scotland by Professional Degree
In terms of professional degree, the demographic groups most similar to Immigrants from Scotland are Egyptian (5.3%, a difference of 0.10%), Chilean (5.3%, a difference of 0.10%), Laotian (5.2%, a difference of 0.16%), Immigrants from Eastern Europe (5.2%, a difference of 0.20%), and Immigrants from Chile (5.3%, a difference of 0.24%).
| Demographics | Rating | Rank | Professional Degree |
| Carpatho Rusyns | 99.6 /100 | #83 | Exceptional 5.3% |
| Immigrants | Croatia | 99.6 /100 | #84 | Exceptional 5.3% |
| Immigrants | Zimbabwe | 99.6 /100 | #85 | Exceptional 5.3% |
| Greeks | 99.6 /100 | #86 | Exceptional 5.3% |
| Immigrants | Chile | 99.5 /100 | #87 | Exceptional 5.3% |
| Egyptians | 99.5 /100 | #88 | Exceptional 5.3% |
| Chileans | 99.5 /100 | #89 | Exceptional 5.3% |
| Immigrants | Scotland | 99.5 /100 | #90 | Exceptional 5.3% |
| Laotians | 99.5 /100 | #91 | Exceptional 5.2% |
| Immigrants | Eastern Europe | 99.5 /100 | #92 | Exceptional 5.2% |
| Northern Europeans | 99.3 /100 | #93 | Exceptional 5.2% |
| Alsatians | 99.3 /100 | #94 | Exceptional 5.2% |
| Zimbabweans | 99.3 /100 | #95 | Exceptional 5.2% |
| Immigrants | Uzbekistan | 99.2 /100 | #96 | Exceptional 5.2% |
| Syrians | 99.1 /100 | #97 | Exceptional 5.2% |
Demographics Similar to Sub-Saharan Africans by Professional Degree
In terms of professional degree, the demographic groups most similar to Sub-Saharan Africans are Immigrants from Somalia (4.1%, a difference of 0.080%), Immigrants from Panama (4.1%, a difference of 0.16%), Yugoslavian (4.1%, a difference of 0.24%), Immigrants from Nigeria (4.1%, a difference of 0.38%), and German (4.1%, a difference of 0.42%).
| Demographics | Rating | Rank | Professional Degree |
| Immigrants | North Macedonia | 20.2 /100 | #200 | Fair 4.2% |
| Finns | 18.7 /100 | #201 | Poor 4.2% |
| Immigrants | Iraq | 17.1 /100 | #202 | Poor 4.2% |
| Panamanians | 15.9 /100 | #203 | Poor 4.1% |
| Barbadians | 15.8 /100 | #204 | Poor 4.1% |
| Somalis | 14.8 /100 | #205 | Poor 4.1% |
| Yugoslavians | 13.4 /100 | #206 | Poor 4.1% |
| Sub-Saharan Africans | 12.8 /100 | #207 | Poor 4.1% |
| Immigrants | Somalia | 12.5 /100 | #208 | Poor 4.1% |
| Immigrants | Panama | 12.3 /100 | #209 | Poor 4.1% |
| Immigrants | Nigeria | 11.7 /100 | #210 | Poor 4.1% |
| Germans | 11.6 /100 | #211 | Poor 4.1% |
| Whites/Caucasians | 11.2 /100 | #212 | Poor 4.1% |
| Koreans | 10.7 /100 | #213 | Poor 4.1% |
| Immigrants | Ghana | 10.6 /100 | #214 | Poor 4.1% |