Immigrants from Scotland vs Slavic College, Under 1 year
COMPARE
Immigrants from Scotland
Slavic
College, Under 1 year
College, Under 1 year Comparison
Immigrants from Scotland
Slavs
69.4%
COLLEGE, UNDER 1 YEAR
99.6/ 100
METRIC RATING
56th/ 347
METRIC RANK
66.7%
COLLEGE, UNDER 1 YEAR
85.9/ 100
METRIC RATING
140th/ 347
METRIC RANK
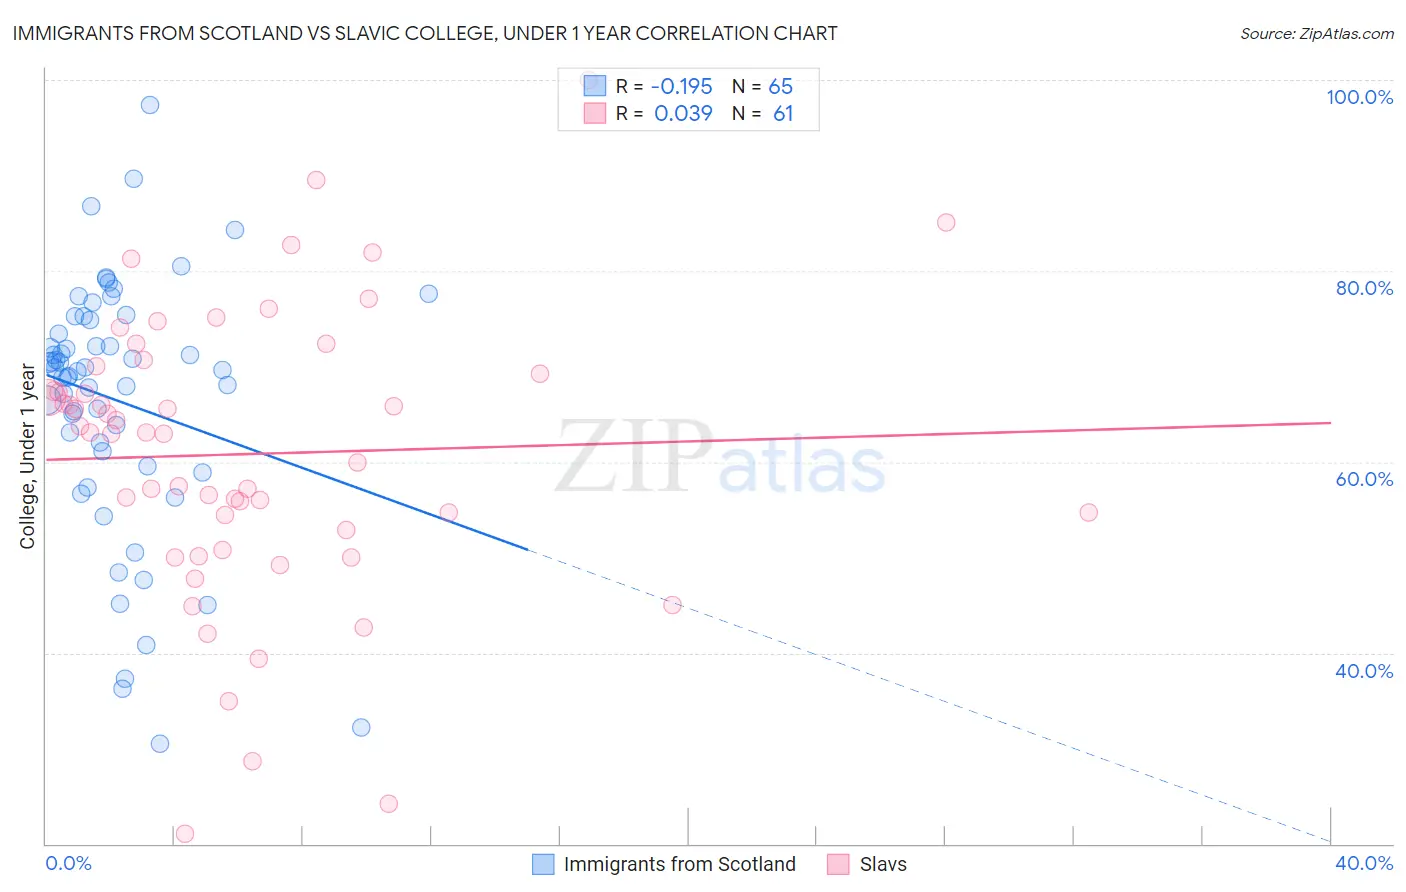
Immigrants from Scotland vs Slavic College, Under 1 year Correlation Chart
The statistical analysis conducted on geographies consisting of 196,397,263 people shows a poor negative correlation between the proportion of Immigrants from Scotland and percentage of population with at least college, under 1 year education in the United States with a correlation coefficient (R) of -0.195 and weighted average of 69.4%. Similarly, the statistical analysis conducted on geographies consisting of 270,867,455 people shows no correlation between the proportion of Slavs and percentage of population with at least college, under 1 year education in the United States with a correlation coefficient (R) of 0.039 and weighted average of 66.7%, a difference of 4.1%.
College, Under 1 year Correlation Summary
| Measurement | Immigrants from Scotland | Slavic |
| Minimum | 30.5% | 21.0% |
| Maximum | 97.4% | 100.0% |
| Range | 66.9% | 79.0% |
| Mean | 66.4% | 60.8% |
| Median | 69.7% | 63.0% |
| Interquartile 25% (IQ1) | 60.3% | 51.8% |
| Interquartile 75% (IQ3) | 75.1% | 69.7% |
| Interquartile Range (IQR) | 14.7% | 17.9% |
| Standard Deviation (Sample) | 13.4% | 15.1% |
| Standard Deviation (Population) | 13.3% | 14.9% |
Similar Demographics by College, Under 1 year
Demographics Similar to Immigrants from Scotland by College, Under 1 year
In terms of college, under 1 year, the demographic groups most similar to Immigrants from Scotland are Asian (69.4%, a difference of 0.020%), Maltese (69.5%, a difference of 0.12%), Immigrants from Malaysia (69.3%, a difference of 0.12%), Immigrants from Czechoslovakia (69.6%, a difference of 0.22%), and Immigrants from Serbia (69.3%, a difference of 0.25%).
| Demographics | Rating | Rank | College, Under 1 year |
| Immigrants | Austria | 99.8 /100 | #49 | Exceptional 70.0% |
| Zimbabweans | 99.8 /100 | #50 | Exceptional 69.9% |
| Mongolians | 99.8 /100 | #51 | Exceptional 69.9% |
| Immigrants | Russia | 99.8 /100 | #52 | Exceptional 69.9% |
| South Africans | 99.7 /100 | #53 | Exceptional 69.7% |
| Immigrants | Czechoslovakia | 99.7 /100 | #54 | Exceptional 69.6% |
| Maltese | 99.7 /100 | #55 | Exceptional 69.5% |
| Immigrants | Scotland | 99.6 /100 | #56 | Exceptional 69.4% |
| Asians | 99.6 /100 | #57 | Exceptional 69.4% |
| Immigrants | Malaysia | 99.6 /100 | #58 | Exceptional 69.3% |
| Immigrants | Serbia | 99.5 /100 | #59 | Exceptional 69.3% |
| Immigrants | Asia | 99.5 /100 | #60 | Exceptional 69.2% |
| Immigrants | Kazakhstan | 99.5 /100 | #61 | Exceptional 69.2% |
| Immigrants | Belarus | 99.5 /100 | #62 | Exceptional 69.2% |
| Immigrants | Canada | 99.4 /100 | #63 | Exceptional 69.1% |
Demographics Similar to Slavs by College, Under 1 year
In terms of college, under 1 year, the demographic groups most similar to Slavs are Venezuelan (66.7%, a difference of 0.0%), Immigrants from Afghanistan (66.7%, a difference of 0.070%), Immigrants from Italy (66.8%, a difference of 0.10%), Immigrants from Chile (66.8%, a difference of 0.15%), and Ugandan (66.8%, a difference of 0.18%).
| Demographics | Rating | Rank | College, Under 1 year |
| Immigrants | Brazil | 88.3 /100 | #133 | Excellent 66.9% |
| Iraqis | 88.0 /100 | #134 | Excellent 66.8% |
| Canadians | 87.9 /100 | #135 | Excellent 66.8% |
| Ugandans | 87.8 /100 | #136 | Excellent 66.8% |
| Immigrants | Chile | 87.4 /100 | #137 | Excellent 66.8% |
| Immigrants | Italy | 86.9 /100 | #138 | Excellent 66.8% |
| Venezuelans | 85.9 /100 | #139 | Excellent 66.7% |
| Slavs | 85.9 /100 | #140 | Excellent 66.7% |
| Immigrants | Afghanistan | 85.1 /100 | #141 | Excellent 66.7% |
| English | 82.9 /100 | #142 | Excellent 66.6% |
| Immigrants | Uganda | 82.8 /100 | #143 | Excellent 66.5% |
| Immigrants | Germany | 82.0 /100 | #144 | Excellent 66.5% |
| Immigrants | Kenya | 81.8 /100 | #145 | Excellent 66.5% |
| Kenyans | 81.7 /100 | #146 | Excellent 66.5% |
| Immigrants | Morocco | 81.7 /100 | #147 | Excellent 66.5% |