Immigrants from Scotland vs Seminole Bachelor's Degree
COMPARE
Immigrants from Scotland
Seminole
Bachelor's Degree
Bachelor's Degree Comparison
Immigrants from Scotland
Seminole
42.3%
BACHELOR'S DEGREE
99.2/ 100
METRIC RATING
82nd/ 347
METRIC RANK
29.4%
BACHELOR'S DEGREE
0.0/ 100
METRIC RATING
312th/ 347
METRIC RANK
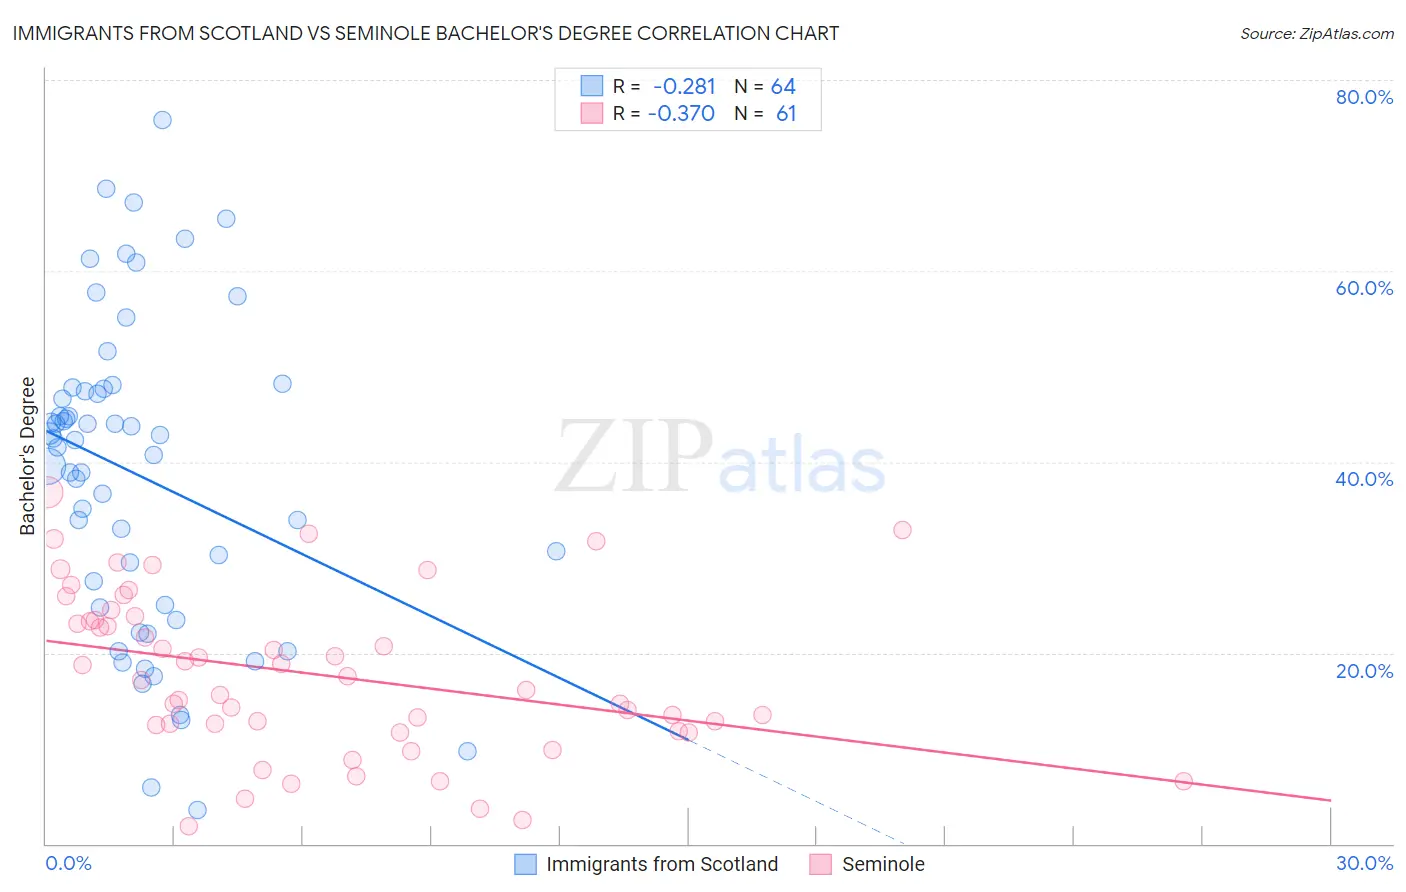
Immigrants from Scotland vs Seminole Bachelor's Degree Correlation Chart
The statistical analysis conducted on geographies consisting of 196,394,351 people shows a weak negative correlation between the proportion of Immigrants from Scotland and percentage of population with at least bachelor's degree education in the United States with a correlation coefficient (R) of -0.281 and weighted average of 42.3%. Similarly, the statistical analysis conducted on geographies consisting of 118,312,408 people shows a mild negative correlation between the proportion of Seminole and percentage of population with at least bachelor's degree education in the United States with a correlation coefficient (R) of -0.370 and weighted average of 29.4%, a difference of 43.8%.
Bachelor's Degree Correlation Summary
| Measurement | Immigrants from Scotland | Seminole |
| Minimum | 3.5% | 1.9% |
| Maximum | 75.8% | 36.8% |
| Range | 72.3% | 34.9% |
| Mean | 38.6% | 17.7% |
| Median | 41.8% | 17.1% |
| Interquartile 25% (IQ1) | 24.9% | 12.1% |
| Interquartile 75% (IQ3) | 47.5% | 23.6% |
| Interquartile Range (IQR) | 22.6% | 11.6% |
| Standard Deviation (Sample) | 16.4% | 8.5% |
| Standard Deviation (Population) | 16.2% | 8.4% |
Similar Demographics by Bachelor's Degree
Demographics Similar to Immigrants from Scotland by Bachelor's Degree
In terms of bachelor's degree, the demographic groups most similar to Immigrants from Scotland are Armenian (42.3%, a difference of 0.030%), Immigrants from Western Asia (42.3%, a difference of 0.050%), Immigrants from Hungary (42.3%, a difference of 0.070%), Lithuanian (42.2%, a difference of 0.070%), and Immigrants from Croatia (42.3%, a difference of 0.080%).
| Demographics | Rating | Rank | Bachelor's Degree |
| Immigrants | Zimbabwe | 99.4 /100 | #75 | Exceptional 42.6% |
| Immigrants | Egypt | 99.4 /100 | #76 | Exceptional 42.6% |
| Immigrants | Eastern Europe | 99.4 /100 | #77 | Exceptional 42.5% |
| Immigrants | Ethiopia | 99.4 /100 | #78 | Exceptional 42.5% |
| Immigrants | Lebanon | 99.3 /100 | #79 | Exceptional 42.4% |
| Immigrants | Croatia | 99.2 /100 | #80 | Exceptional 42.3% |
| Immigrants | Hungary | 99.2 /100 | #81 | Exceptional 42.3% |
| Immigrants | Scotland | 99.2 /100 | #82 | Exceptional 42.3% |
| Armenians | 99.2 /100 | #83 | Exceptional 42.3% |
| Immigrants | Western Asia | 99.2 /100 | #84 | Exceptional 42.3% |
| Lithuanians | 99.2 /100 | #85 | Exceptional 42.2% |
| Immigrants | Brazil | 99.2 /100 | #86 | Exceptional 42.2% |
| Carpatho Rusyns | 99.0 /100 | #87 | Exceptional 42.1% |
| Immigrants | Western Europe | 99.0 /100 | #88 | Exceptional 42.0% |
| Greeks | 99.0 /100 | #89 | Exceptional 42.0% |
Demographics Similar to Seminole by Bachelor's Degree
In terms of bachelor's degree, the demographic groups most similar to Seminole are Choctaw (29.4%, a difference of 0.060%), Cheyenne (29.4%, a difference of 0.13%), Alaska Native (29.4%, a difference of 0.18%), Shoshone (29.3%, a difference of 0.48%), and Immigrants from Cabo Verde (29.2%, a difference of 0.56%).
| Demographics | Rating | Rank | Bachelor's Degree |
| Immigrants | Latin America | 0.0 /100 | #305 | Tragic 30.1% |
| Immigrants | Yemen | 0.0 /100 | #306 | Tragic 29.9% |
| Nepalese | 0.0 /100 | #307 | Tragic 29.9% |
| Cajuns | 0.0 /100 | #308 | Tragic 29.6% |
| Hispanics or Latinos | 0.0 /100 | #309 | Tragic 29.6% |
| Cheyenne | 0.0 /100 | #310 | Tragic 29.4% |
| Choctaw | 0.0 /100 | #311 | Tragic 29.4% |
| Seminole | 0.0 /100 | #312 | Tragic 29.4% |
| Alaska Natives | 0.0 /100 | #313 | Tragic 29.4% |
| Shoshone | 0.0 /100 | #314 | Tragic 29.3% |
| Immigrants | Cabo Verde | 0.0 /100 | #315 | Tragic 29.2% |
| Sioux | 0.0 /100 | #316 | Tragic 29.1% |
| Colville | 0.0 /100 | #317 | Tragic 29.0% |
| Yaqui | 0.0 /100 | #318 | Tragic 29.0% |
| Creek | 0.0 /100 | #319 | Tragic 28.9% |