Immigrants from Scotland vs Lumbee 5th Grade
COMPARE
Immigrants from Scotland
Lumbee
5th Grade
5th Grade Comparison
Immigrants from Scotland
Lumbee
98.0%
5TH GRADE
99.8/ 100
METRIC RATING
50th/ 347
METRIC RANK
97.8%
5TH GRADE
99.3/ 100
METRIC RATING
74th/ 347
METRIC RANK
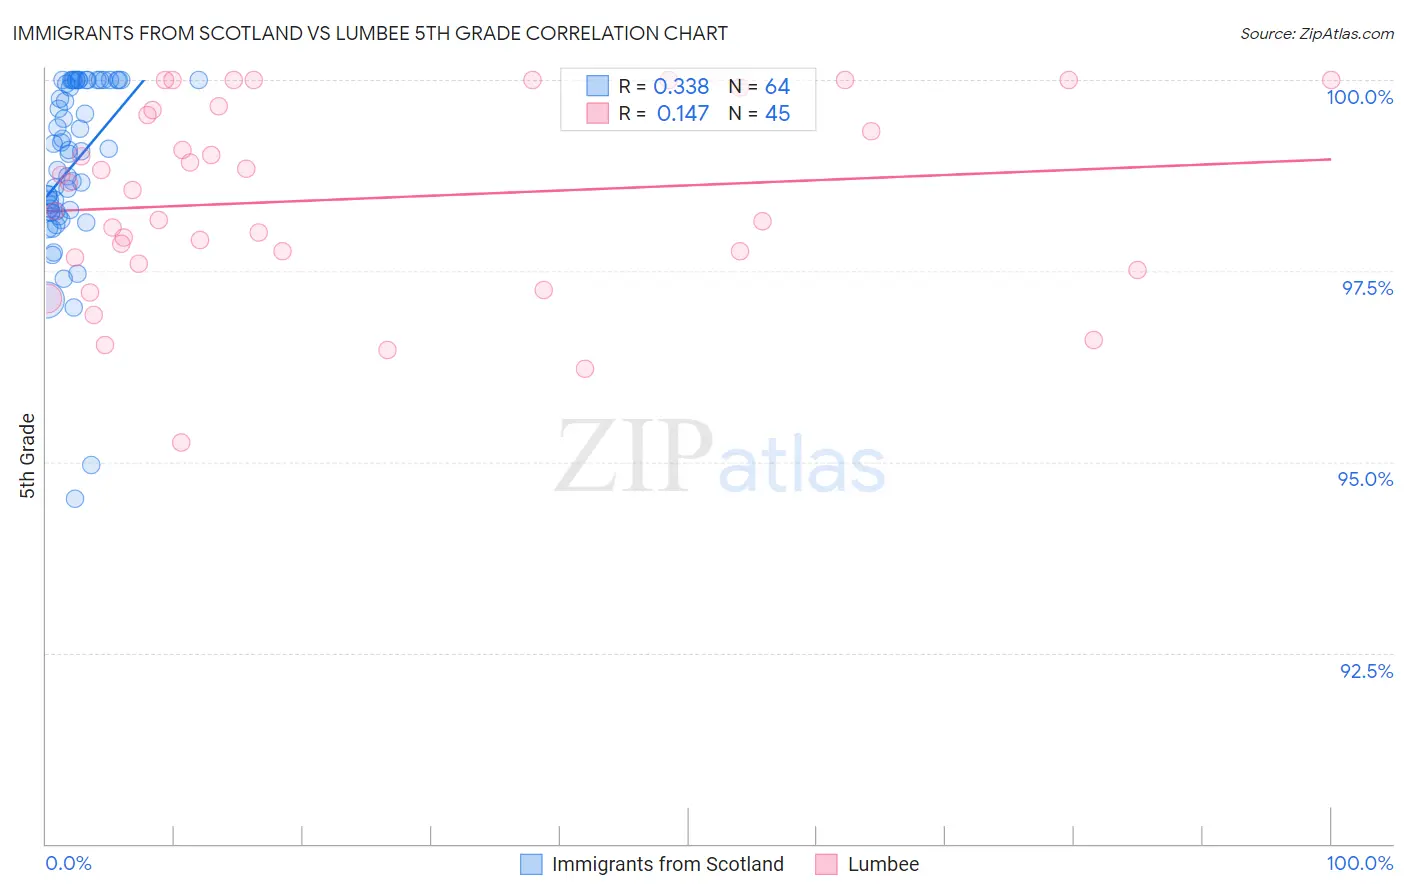
Immigrants from Scotland vs Lumbee 5th Grade Correlation Chart
The statistical analysis conducted on geographies consisting of 196,398,887 people shows a mild positive correlation between the proportion of Immigrants from Scotland and percentage of population with at least 5th grade education in the United States with a correlation coefficient (R) of 0.338 and weighted average of 98.0%. Similarly, the statistical analysis conducted on geographies consisting of 92,298,549 people shows a poor positive correlation between the proportion of Lumbee and percentage of population with at least 5th grade education in the United States with a correlation coefficient (R) of 0.147 and weighted average of 97.8%, a difference of 0.14%.
5th Grade Correlation Summary
| Measurement | Immigrants from Scotland | Lumbee |
| Minimum | 94.5% | 95.3% |
| Maximum | 100.0% | 100.0% |
| Range | 5.5% | 4.7% |
| Mean | 98.9% | 98.4% |
| Median | 99.1% | 98.6% |
| Interquartile 25% (IQ1) | 98.3% | 97.6% |
| Interquartile 75% (IQ3) | 100.0% | 99.6% |
| Interquartile Range (IQR) | 1.7% | 2.0% |
| Standard Deviation (Sample) | 1.1% | 1.2% |
| Standard Deviation (Population) | 1.1% | 1.2% |
Similar Demographics by 5th Grade
Demographics Similar to Immigrants from Scotland by 5th Grade
In terms of 5th grade, the demographic groups most similar to Immigrants from Scotland are Estonian (98.0%, a difference of 0.0%), Celtic (98.0%, a difference of 0.0%), Bulgarian (98.0%, a difference of 0.010%), Maltese (98.0%, a difference of 0.010%), and Slavic (98.0%, a difference of 0.010%).
| Demographics | Rating | Rank | 5th Grade |
| Ottawa | 99.9 /100 | #43 | Exceptional 98.0% |
| Aleuts | 99.9 /100 | #44 | Exceptional 98.0% |
| Czechoslovakians | 99.9 /100 | #45 | Exceptional 98.0% |
| Arapaho | 99.9 /100 | #46 | Exceptional 98.0% |
| Native Hawaiians | 99.9 /100 | #47 | Exceptional 98.0% |
| Bulgarians | 99.8 /100 | #48 | Exceptional 98.0% |
| Estonians | 99.8 /100 | #49 | Exceptional 98.0% |
| Immigrants | Scotland | 99.8 /100 | #50 | Exceptional 98.0% |
| Celtics | 99.8 /100 | #51 | Exceptional 98.0% |
| Maltese | 99.8 /100 | #52 | Exceptional 98.0% |
| Slavs | 99.8 /100 | #53 | Exceptional 98.0% |
| Australians | 99.8 /100 | #54 | Exceptional 98.0% |
| Creek | 99.8 /100 | #55 | Exceptional 98.0% |
| Greeks | 99.8 /100 | #56 | Exceptional 97.9% |
| Austrians | 99.8 /100 | #57 | Exceptional 97.9% |
Demographics Similar to Lumbee by 5th Grade
In terms of 5th grade, the demographic groups most similar to Lumbee are Cherokee (97.8%, a difference of 0.0%), Ukrainian (97.8%, a difference of 0.0%), Immigrants from Netherlands (97.8%, a difference of 0.0%), Immigrants from England (97.8%, a difference of 0.010%), and Osage (97.8%, a difference of 0.010%).
| Demographics | Rating | Rank | 5th Grade |
| New Zealanders | 99.6 /100 | #67 | Exceptional 97.9% |
| Cajuns | 99.6 /100 | #68 | Exceptional 97.9% |
| Kiowa | 99.5 /100 | #69 | Exceptional 97.9% |
| Iranians | 99.5 /100 | #70 | Exceptional 97.9% |
| Chickasaw | 99.5 /100 | #71 | Exceptional 97.9% |
| Macedonians | 99.4 /100 | #72 | Exceptional 97.9% |
| Cherokee | 99.4 /100 | #73 | Exceptional 97.8% |
| Lumbee | 99.3 /100 | #74 | Exceptional 97.8% |
| Ukrainians | 99.3 /100 | #75 | Exceptional 97.8% |
| Immigrants | Netherlands | 99.3 /100 | #76 | Exceptional 97.8% |
| Immigrants | England | 99.3 /100 | #77 | Exceptional 97.8% |
| Osage | 99.3 /100 | #78 | Exceptional 97.8% |
| Immigrants | Lithuania | 99.2 /100 | #79 | Exceptional 97.8% |
| Immigrants | India | 99.2 /100 | #80 | Exceptional 97.8% |
| Icelanders | 99.2 /100 | #81 | Exceptional 97.8% |