Immigrants from Scotland vs Immigrants from France 9th Grade

COMPARE

Immigrants from Scotland
Race
Ancestry
AfghanAfricanAlaska NativeAlaskan AthabascanAlbanianAleutAlsatianAmericanApacheArabArapahoArgentineanArmenianAssyrian/Chaldean/SyriacAustralianAustrianBahamianBangladeshiBarbadianBasqueBelgianBelizeanBermudanBhutaneseBlackfeetBolivianBrazilianBritishBritish West IndianBulgarianBurmeseCajunCambodianCanadianCape VerdeanCarpatho RusynCelticCentral AmericanCentral American IndianCherokeeCheyenneChickasawChileanChineseChippewaChoctawColombianColvilleComancheCosta RicanCreeCreekCroatianCrowCubanCypriotCzechCzechoslovakianDanishDelawareDominicanDutchDutch West IndianEastern EuropeanEcuadorianEgyptianEnglishEstonianEthiopianEuropeanFijianFilipinoFinnishFrenchFrench American IndianFrench CanadianGermanGerman RussianGhanaianGreekGuamanian/ChamorroGuatemalanGuyaneseHaitianHmongHonduranHopiHoumaHungarianIcelanderIndian (Asian)IndonesianInupiatIranianIraqiIrishIroquoisIsraeliItalianJamaicanJapaneseJordanianKenyanKiowaKoreanLaotianLatvianLebaneseLiberianLithuanianLumbeeLuxembourgerMacedonianMalaysianMalteseMarshalleseMenomineeMexicanMexican American IndianMongolianMoroccanNative HawaiianNavajoNepaleseNew ZealanderNicaraguanNigerianNorthern EuropeanNorwegianOkinawanOsageOttawaPaiutePakistaniPalestinianPanamanianParaguayanPennsylvania GermanPeruvianPimaPolishPortuguesePotawatomiPuebloPuerto RicanPuget Sound SalishRomanianRussianSalvadoranSamoanScandinavianScotch-IrishScottishSeminoleSenegaleseSerbianShoshoneSierra LeoneanSiouxSlavicSlovakSloveneSomaliSouth AfricanSouth AmericanSouth American IndianSoviet UnionSpaniardSpanishSpanish AmericanSpanish American IndianSri LankanSubsaharan AfricanSudaneseSwedishSwissSyrianTaiwaneseThaiTlingit-HaidaTohono O'OdhamTonganTrinidadian and TobagonianTsimshianTurkishU.S. Virgin IslanderUgandanUkrainianUruguayanUteVenezuelanVietnameseWelshWest IndianYakamaYaquiYugoslavianYumanYup'ikZimbabwean
Immigration
NonimmigrantsImmigrantsAfghanistanAfricaAlbaniaArgentinaArmeniaAsiaAustraliaAustriaBahamasBangladeshBarbadosBelarusBelgiumBelizeBoliviaBosnia and HerzegovinaBrazilBulgariaBurma/MyanmarCabo VerdeCambodiaCameroonCanadaCaribbeanCentral AmericaChileChinaColombiaCongoCosta RicaCroatiaCubaCzechoslovakiaDenmarkDominicaDominican RepublicEastern AfricaEastern AsiaEastern EuropeEcuadorEgyptEl SalvadorEnglandEritreaEthiopiaEuropeFijiGermanyGhanaGreeceGrenadaGuatemalaGuyanaHaitiHondurasHong KongHungaryIndiaIndonesiaIranIraqIrelandIsraelItalyJamaicaJapanJordanKazakhstanKenyaKoreaKuwaitLaosLatin AmericaLatviaLebanonLiberiaLithuaniaMalaysiaMexicoMicronesiaMiddle AfricaMoldovaMoroccoNepalNetherlandsNicaraguaNigeriaNorth AmericaNorth MacedoniaNorthern AfricaNorthern EuropeNorwayOceaniaPakistanPanamaPeruPhilippinesPolandPortugalRomaniaRussiaSaudi ArabiaScotlandSenegalSerbiaSierra LeoneSingaporeSomaliaSouth AfricaSouth AmericaSouth Central AsiaSouth Eastern AsiaSouthern EuropeSpainSri LankaSt. Vincent and the GrenadinesSudanSwedenSwitzerlandSyriaTaiwanThailandTrinidad and TobagoTurkeyUgandaUkraineUruguayUzbekistanVenezuelaVietnamWest IndiesWestern AfricaWestern AsiaWestern EuropeYemenZaireZimbabweAzores
Immigrants from France
Race
Ancestry
AfghanAfricanAlaska NativeAlaskan AthabascanAlbanianAleutAlsatianAmericanApacheArabArapahoArgentineanArmenianAssyrian/Chaldean/SyriacAustralianAustrianBahamianBangladeshiBarbadianBasqueBelgianBelizeanBermudanBhutaneseBlackfeetBolivianBrazilianBritishBritish West IndianBulgarianBurmeseCajunCambodianCanadianCape VerdeanCarpatho RusynCelticCentral AmericanCentral American IndianCherokeeCheyenneChickasawChileanChineseChippewaChoctawColombianColvilleComancheCosta RicanCreeCreekCroatianCrowCubanCypriotCzechCzechoslovakianDanishDelawareDominicanDutchDutch West IndianEastern EuropeanEcuadorianEgyptianEnglishEstonianEthiopianEuropeanFijianFilipinoFinnishFrenchFrench American IndianFrench CanadianGermanGerman RussianGhanaianGreekGuamanian/ChamorroGuatemalanGuyaneseHaitianHmongHonduranHopiHoumaHungarianIcelanderIndian (Asian)IndonesianInupiatIranianIraqiIrishIroquoisIsraeliItalianJamaicanJapaneseJordanianKenyanKiowaKoreanLaotianLatvianLebaneseLiberianLithuanianLumbeeLuxembourgerMacedonianMalaysianMalteseMarshalleseMenomineeMexicanMexican American IndianMongolianMoroccanNative HawaiianNavajoNepaleseNew ZealanderNicaraguanNigerianNorthern EuropeanNorwegianOkinawanOsageOttawaPaiutePakistaniPalestinianPanamanianParaguayanPennsylvania GermanPeruvianPimaPolishPortuguesePotawatomiPuebloPuerto RicanPuget Sound SalishRomanianRussianSalvadoranSamoanScandinavianScotch-IrishScottishSeminoleSenegaleseSerbianShoshoneSierra LeoneanSiouxSlavicSlovakSloveneSomaliSouth AfricanSouth AmericanSouth American IndianSoviet UnionSpaniardSpanishSpanish AmericanSpanish American IndianSri LankanSubsaharan AfricanSudaneseSwedishSwissSyrianTaiwaneseThaiTlingit-HaidaTohono O'OdhamTonganTrinidadian and TobagonianTsimshianTurkishU.S. Virgin IslanderUgandanUkrainianUruguayanUteVenezuelanVietnameseWelshWest IndianYakamaYaquiYugoslavianYumanYup'ikZimbabwean
Immigration
NonimmigrantsImmigrantsAfghanistanAfricaAlbaniaArgentinaArmeniaAsiaAustraliaAustriaBahamasBangladeshBarbadosBelarusBelgiumBelizeBoliviaBosnia and HerzegovinaBrazilBulgariaBurma/MyanmarCabo VerdeCambodiaCameroonCanadaCaribbeanCentral AmericaChileChinaColombiaCongoCosta RicaCroatiaCubaCzechoslovakiaDenmarkDominicaDominican RepublicEastern AfricaEastern AsiaEastern EuropeEcuadorEgyptEl SalvadorEnglandEritreaEthiopiaEuropeFijiFranceGermanyGhanaGreeceGrenadaGuatemalaGuyanaHaitiHondurasHong KongHungaryIndiaIndonesiaIranIraqIrelandIsraelItalyJamaicaJapanJordanKazakhstanKenyaKoreaKuwaitLaosLatin AmericaLatviaLebanonLiberiaLithuaniaMalaysiaMexicoMicronesiaMiddle AfricaMoldovaMoroccoNepalNetherlandsNicaraguaNigeriaNorth AmericaNorth MacedoniaNorthern AfricaNorthern EuropeNorwayOceaniaPakistanPanamaPeruPhilippinesPolandPortugalRomaniaRussiaSaudi ArabiaSenegalSerbiaSierra LeoneSingaporeSomaliaSouth AfricaSouth AmericaSouth Central AsiaSouth Eastern AsiaSouthern EuropeSpainSri LankaSt. Vincent and the GrenadinesSudanSwedenSwitzerlandSyriaTaiwanThailandTrinidad and TobagoTurkeyUgandaUkraineUruguayUzbekistanVenezuelaVietnamWest IndiesWestern AfricaWestern AsiaWestern EuropeYemenZaireZimbabweAzores
9th Grade
Income
Poverty
Unemployment
Labor Participation
Family Structure
Vehicle Availability
Education Level
Disability

9th Grade Comparison

Immigrants from Scotland

Immigrants from France

Exceptional
Exceptional
96.1%
9TH GRADE
99.9/ 100
METRIC RATING
38th/ 347
METRIC RANK
95.5%
9TH GRADE
97.4/ 100
METRIC RATING
105th/ 347
METRIC RANK

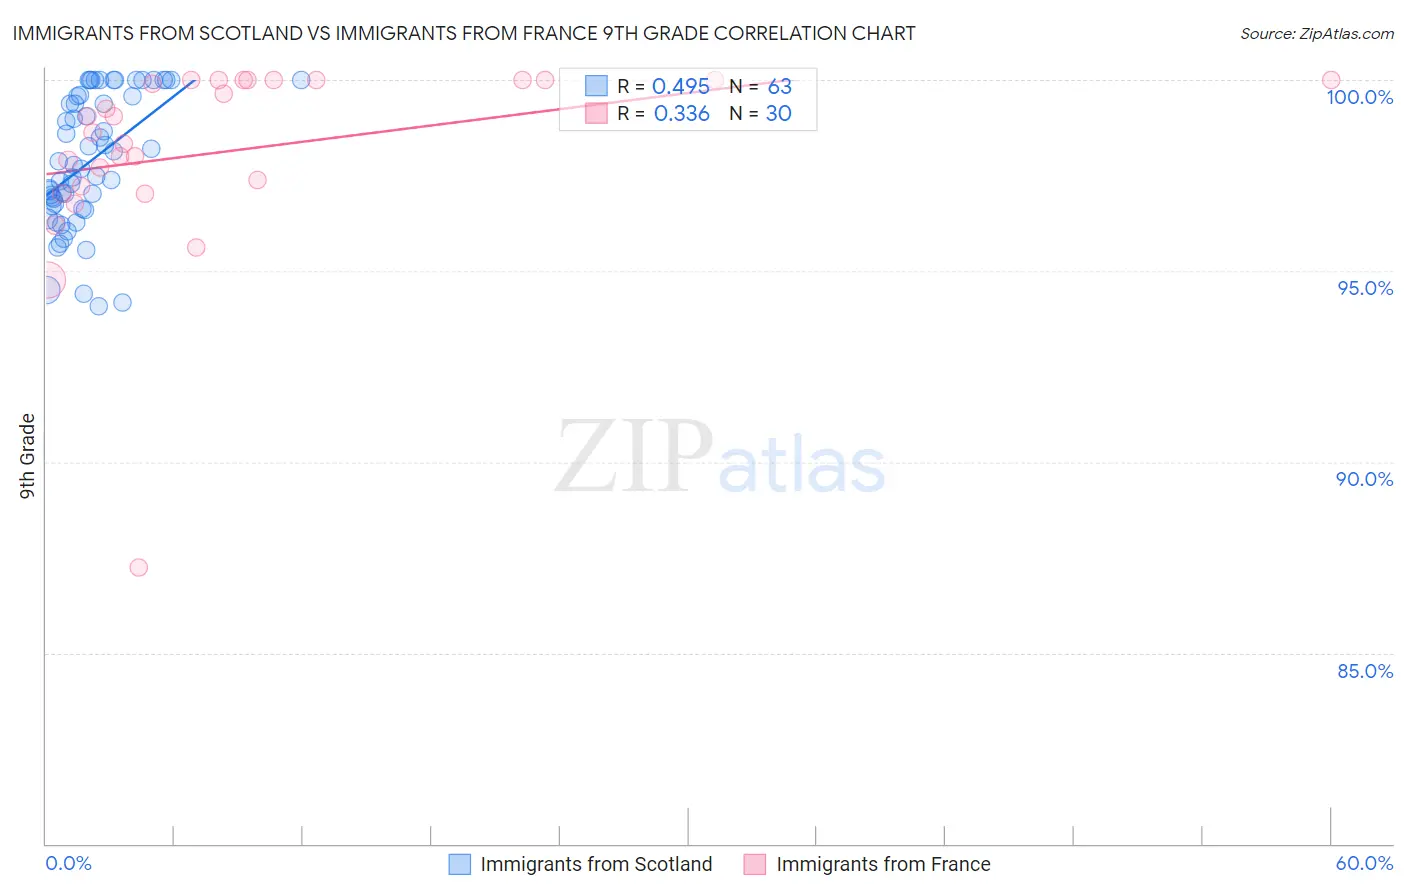
Immigrants from Scotland vs Immigrants from France 9th Grade Correlation Chart

The statistical analysis conducted on geographies consisting of 196,394,967 people shows a moderate positive correlation between the proportion of Immigrants from Scotland and percentage of population with at least 9th grade education in the United States with a correlation coefficient (R) of 0.495 and weighted average of 96.1%. Similarly, the statistical analysis conducted on geographies consisting of 287,920,814 people shows a mild positive correlation between the proportion of Immigrants from France and percentage of population with at least 9th grade education in the United States with a correlation coefficient (R) of 0.336 and weighted average of 95.5%, a difference of 0.67%.
Immigrants from Scotland vs Immigrants from France 9th Grade

9th Grade Correlation Summary

MeasurementImmigrants from ScotlandImmigrants from France
Minimum94.1%87.2%
Maximum100.0%100.0%
Range5.9%12.8%
Mean97.9%98.2%
Median97.8%98.8%
Interquartile 25% (IQ1)96.7%97.2%
Interquartile 75% (IQ3)99.6%100.0%
Interquartile Range (IQR)2.9%2.8%
Standard Deviation (Sample)1.7%2.6%
Standard Deviation (Population)1.7%2.5%

Similar Demographics by 9th Grade

Demographics Similar to Immigrants from Scotland by 9th Grade

In terms of 9th grade, the demographic groups most similar to Immigrants from Scotland are Estonian (96.1%, a difference of 0.0%), Ottawa (96.1%, a difference of 0.020%), Northern European (96.2%, a difference of 0.040%), Slavic (96.1%, a difference of 0.040%), and Bulgarian (96.2%, a difference of 0.050%).
DemographicsRating | Rank9th Grade
British
100.0
/100
|
#31
Exceptional
96.3%
Belgians
100.0
/100
|
#32
Exceptional
96.3%
Luxembourgers
100.0
/100
|
#33
Exceptional
96.3%
Hungarians
100.0
/100
|
#34
Exceptional
96.2%
Bulgarians
99.9
/100
|
#35
Exceptional
96.2%
Northern Europeans
99.9
/100
|
#36
Exceptional
96.2%
Estonians
99.9
/100
|
#37
Exceptional
96.1%
Immigrants | Scotland
99.9
/100
|
#38
Exceptional
96.1%
Ottawa
99.9
/100
|
#39
Exceptional
96.1%
Slavs
99.9
/100
|
#40
Exceptional
96.1%
Czechoslovakians
99.9
/100
|
#41
Exceptional
96.1%
Chippewa
99.9
/100
|
#42
Exceptional
96.1%
Iranians
99.9
/100
|
#43
Exceptional
96.1%
Alaska Natives
99.9
/100
|
#44
Exceptional
96.1%
Crow
99.9
/100
|
#45
Exceptional
96.1%

Demographics Similar to Immigrants from France by 9th Grade

In terms of 9th grade, the demographic groups most similar to Immigrants from France are Syrian (95.5%, a difference of 0.0%), Immigrants from Norway (95.5%, a difference of 0.010%), Potawatomi (95.5%, a difference of 0.020%), Immigrants from Switzerland (95.5%, a difference of 0.030%), and Immigrants from Zimbabwe (95.5%, a difference of 0.030%).
DemographicsRating | Rank9th Grade
Immigrants | Japan
98.4
/100
|
#98
Exceptional
95.6%
Menominee
98.3
/100
|
#99
Exceptional
95.6%
Lebanese
98.1
/100
|
#100
Exceptional
95.6%
Immigrants | Moldova
97.9
/100
|
#101
Exceptional
95.5%
Immigrants | Switzerland
97.7
/100
|
#102
Exceptional
95.5%
Potawatomi
97.7
/100
|
#103
Exceptional
95.5%
Syrians
97.4
/100
|
#104
Exceptional
95.5%
Immigrants | France
97.4
/100
|
#105
Exceptional
95.5%
Immigrants | Norway
97.1
/100
|
#106
Exceptional
95.5%
Immigrants | Zimbabwe
96.9
/100
|
#107
Exceptional
95.5%
Chickasaw
96.8
/100
|
#108
Exceptional
95.5%
Osage
96.8
/100
|
#109
Exceptional
95.5%
Immigrants | Bulgaria
96.7
/100
|
#110
Exceptional
95.5%
Cherokee
96.3
/100
|
#111
Exceptional
95.4%
Immigrants | Croatia
96.2
/100
|
#112
Exceptional
95.4%