Immigrants from Scotland vs German 8th Grade
COMPARE
Immigrants from Scotland
German
8th Grade
8th Grade Comparison
Immigrants from Scotland
Germans
96.8%
8TH GRADE
99.9/ 100
METRIC RATING
50th/ 347
METRIC RANK
97.5%
8TH GRADE
100.0/ 100
METRIC RATING
9th/ 347
METRIC RANK
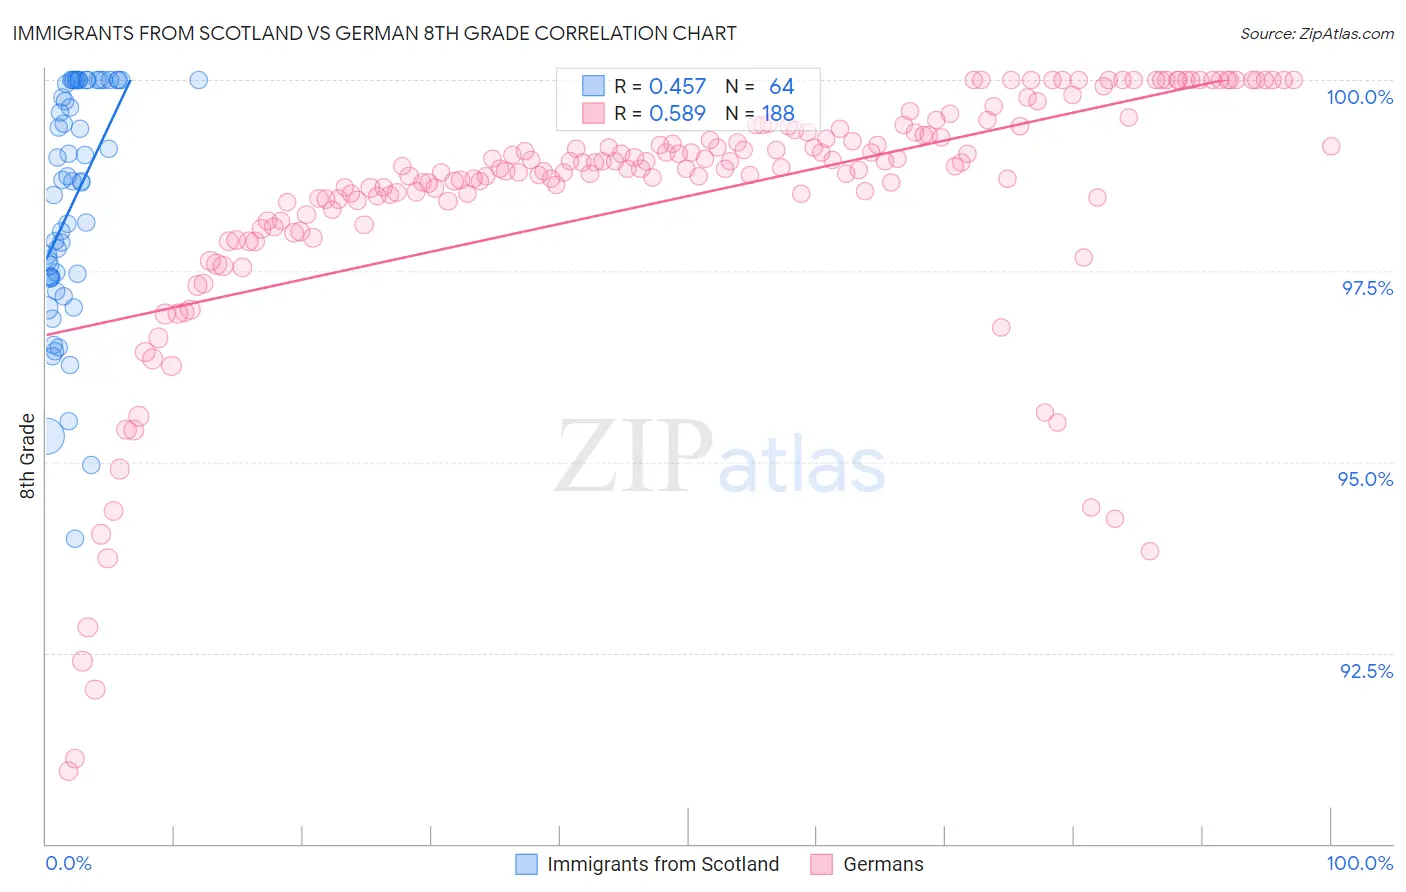
Immigrants from Scotland vs German 8th Grade Correlation Chart
The statistical analysis conducted on geographies consisting of 196,398,887 people shows a moderate positive correlation between the proportion of Immigrants from Scotland and percentage of population with at least 8th grade education in the United States with a correlation coefficient (R) of 0.457 and weighted average of 96.8%. Similarly, the statistical analysis conducted on geographies consisting of 548,360,249 people shows a substantial positive correlation between the proportion of Germans and percentage of population with at least 8th grade education in the United States with a correlation coefficient (R) of 0.589 and weighted average of 97.5%, a difference of 0.76%.
8th Grade Correlation Summary
| Measurement | Immigrants from Scotland | German |
| Minimum | 94.0% | 90.9% |
| Maximum | 100.0% | 100.0% |
| Range | 6.0% | 9.1% |
| Mean | 98.4% | 98.4% |
| Median | 98.7% | 98.8% |
| Interquartile 25% (IQ1) | 97.4% | 98.4% |
| Interquartile 75% (IQ3) | 100.0% | 99.3% |
| Interquartile Range (IQR) | 2.6% | 0.97% |
| Standard Deviation (Sample) | 1.5% | 1.7% |
| Standard Deviation (Population) | 1.5% | 1.7% |
Similar Demographics by 8th Grade
Demographics Similar to Immigrants from Scotland by 8th Grade
In terms of 8th grade, the demographic groups most similar to Immigrants from Scotland are Estonian (96.8%, a difference of 0.010%), Celtic (96.8%, a difference of 0.010%), Slavic (96.8%, a difference of 0.020%), Greek (96.8%, a difference of 0.040%), and Bulgarian (96.9%, a difference of 0.050%).
| Demographics | Rating | Rank | 8th Grade |
| Aleuts | 99.9 /100 | #43 | Exceptional 96.9% |
| Maltese | 99.9 /100 | #44 | Exceptional 96.9% |
| Northern Europeans | 99.9 /100 | #45 | Exceptional 96.9% |
| Czechoslovakians | 99.9 /100 | #46 | Exceptional 96.9% |
| Bulgarians | 99.9 /100 | #47 | Exceptional 96.9% |
| Slavs | 99.9 /100 | #48 | Exceptional 96.8% |
| Estonians | 99.9 /100 | #49 | Exceptional 96.8% |
| Immigrants | Scotland | 99.9 /100 | #50 | Exceptional 96.8% |
| Celtics | 99.9 /100 | #51 | Exceptional 96.8% |
| Greeks | 99.9 /100 | #52 | Exceptional 96.8% |
| Austrians | 99.9 /100 | #53 | Exceptional 96.7% |
| Serbians | 99.8 /100 | #54 | Exceptional 96.7% |
| Russians | 99.8 /100 | #55 | Exceptional 96.7% |
| Australians | 99.8 /100 | #56 | Exceptional 96.7% |
| Macedonians | 99.8 /100 | #57 | Exceptional 96.7% |
Demographics Similar to Germans by 8th Grade
In terms of 8th grade, the demographic groups most similar to Germans are Slovak (97.6%, a difference of 0.030%), Norwegian (97.6%, a difference of 0.070%), Slovene (97.5%, a difference of 0.080%), Polish (97.4%, a difference of 0.11%), and Dutch (97.7%, a difference of 0.14%).
| Demographics | Rating | Rank | 8th Grade |
| Tsimshian | 100.0 /100 | #2 | Exceptional 99.0% |
| Finns | 100.0 /100 | #3 | Exceptional 98.4% |
| Carpatho Rusyns | 100.0 /100 | #4 | Exceptional 98.1% |
| Ottawa | 100.0 /100 | #5 | Exceptional 97.9% |
| Dutch | 100.0 /100 | #6 | Exceptional 97.7% |
| Norwegians | 100.0 /100 | #7 | Exceptional 97.6% |
| Slovaks | 100.0 /100 | #8 | Exceptional 97.6% |
| Germans | 100.0 /100 | #9 | Exceptional 97.5% |
| Slovenes | 100.0 /100 | #10 | Exceptional 97.5% |
| Poles | 100.0 /100 | #11 | Exceptional 97.4% |
| Swedes | 100.0 /100 | #12 | Exceptional 97.4% |
| Alaskan Athabascans | 100.0 /100 | #13 | Exceptional 97.3% |
| English | 100.0 /100 | #14 | Exceptional 97.3% |
| Pennsylvania Germans | 100.0 /100 | #15 | Exceptional 97.3% |
| Tlingit-Haida | 100.0 /100 | #16 | Exceptional 97.3% |