Immigrants from Saudi Arabia vs Israeli Master's Degree
COMPARE
Immigrants from Saudi Arabia
Israeli
Master's Degree
Master's Degree Comparison
Immigrants from Saudi Arabia
Israelis
19.0%
MASTER'S DEGREE
100.0/ 100
METRIC RATING
42nd/ 347
METRIC RANK
20.3%
MASTER'S DEGREE
100.0/ 100
METRIC RATING
22nd/ 347
METRIC RANK
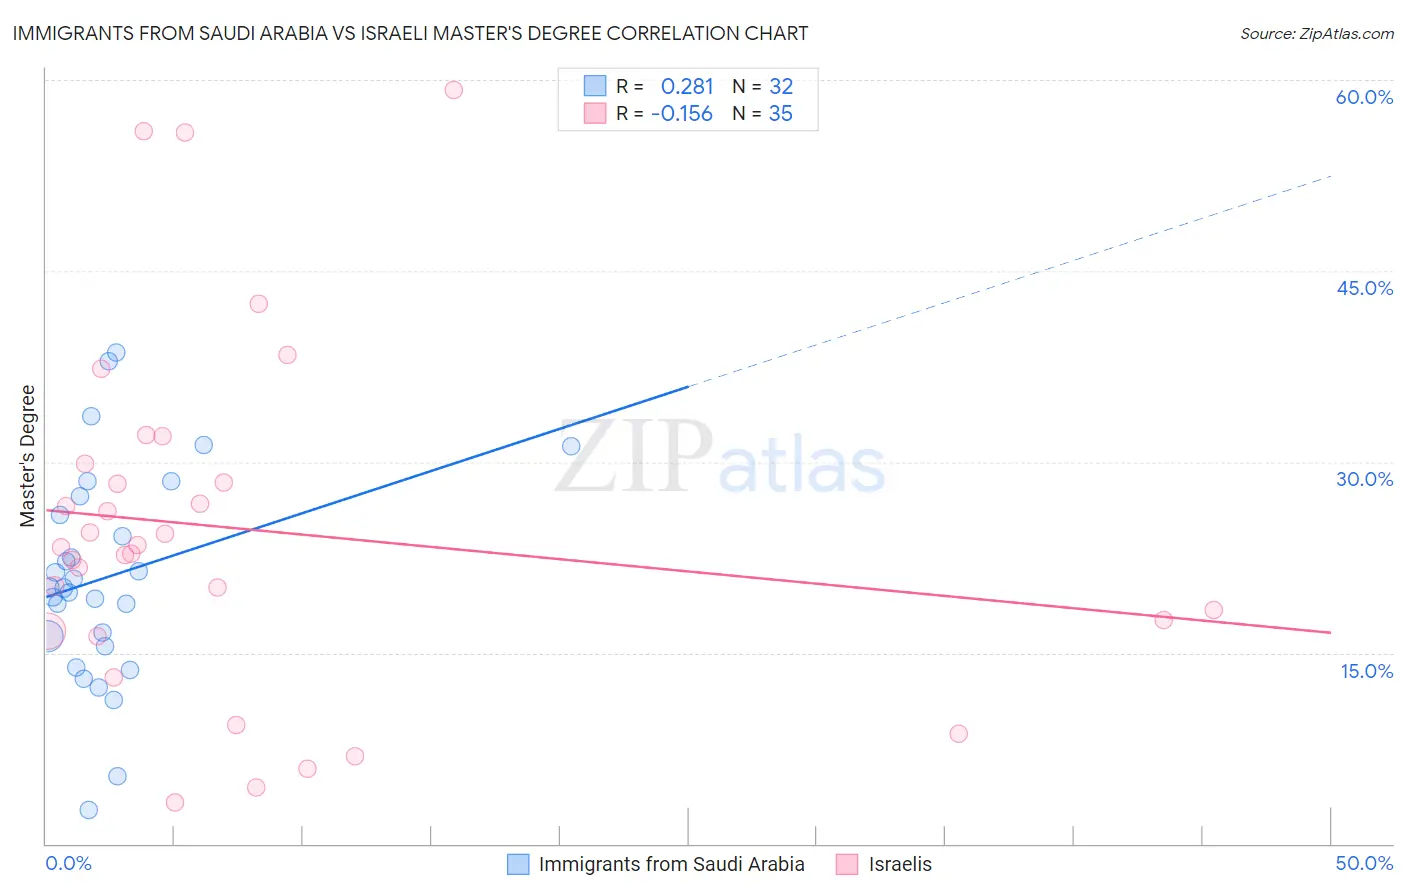
Immigrants from Saudi Arabia vs Israeli Master's Degree Correlation Chart
The statistical analysis conducted on geographies consisting of 164,258,761 people shows a weak positive correlation between the proportion of Immigrants from Saudi Arabia and percentage of population with at least master's degree education in the United States with a correlation coefficient (R) of 0.281 and weighted average of 19.0%. Similarly, the statistical analysis conducted on geographies consisting of 211,131,712 people shows a poor negative correlation between the proportion of Israelis and percentage of population with at least master's degree education in the United States with a correlation coefficient (R) of -0.156 and weighted average of 20.3%, a difference of 7.2%.
Master's Degree Correlation Summary
| Measurement | Immigrants from Saudi Arabia | Israeli |
| Minimum | 2.7% | 3.2% |
| Maximum | 38.6% | 59.3% |
| Range | 35.9% | 56.0% |
| Mean | 21.0% | 24.7% |
| Median | 20.1% | 23.3% |
| Interquartile 25% (IQ1) | 15.9% | 16.7% |
| Interquartile 75% (IQ3) | 26.6% | 29.9% |
| Interquartile Range (IQR) | 10.6% | 13.2% |
| Standard Deviation (Sample) | 8.4% | 13.8% |
| Standard Deviation (Population) | 8.2% | 13.6% |
Demographics Similar to Immigrants from Saudi Arabia and Israelis by Master's Degree
In terms of master's degree, the demographic groups most similar to Immigrants from Saudi Arabia are Immigrants from Latvia (19.1%, a difference of 0.43%), Immigrants from Bolivia (19.1%, a difference of 0.78%), Immigrants from Spain (19.1%, a difference of 0.91%), Bolivian (19.3%, a difference of 1.5%), and Mongolian (19.4%, a difference of 2.3%). Similarly, the demographic groups most similar to Israelis are Immigrants from France (20.3%, a difference of 0.28%), Immigrants from Sweden (20.3%, a difference of 0.35%), Immigrants from Japan (20.0%, a difference of 1.7%), Cambodian (20.0%, a difference of 1.8%), and Immigrants from Sri Lanka (19.9%, a difference of 2.2%).
| Demographics | Rating | Rank | Master's Degree |
| Israelis | 100.0 /100 | #22 | Exceptional 20.3% |
| Immigrants | France | 100.0 /100 | #23 | Exceptional 20.3% |
| Immigrants | Sweden | 100.0 /100 | #24 | Exceptional 20.3% |
| Immigrants | Japan | 100.0 /100 | #25 | Exceptional 20.0% |
| Cambodians | 100.0 /100 | #26 | Exceptional 20.0% |
| Immigrants | Sri Lanka | 100.0 /100 | #27 | Exceptional 19.9% |
| Turks | 100.0 /100 | #28 | Exceptional 19.9% |
| Latvians | 100.0 /100 | #29 | Exceptional 19.8% |
| Immigrants | Turkey | 100.0 /100 | #30 | Exceptional 19.7% |
| Immigrants | Korea | 100.0 /100 | #31 | Exceptional 19.7% |
| Burmese | 100.0 /100 | #32 | Exceptional 19.7% |
| Russians | 100.0 /100 | #33 | Exceptional 19.5% |
| Immigrants | Denmark | 100.0 /100 | #34 | Exceptional 19.5% |
| Immigrants | Northern Europe | 100.0 /100 | #35 | Exceptional 19.5% |
| Immigrants | Russia | 100.0 /100 | #36 | Exceptional 19.4% |
| Mongolians | 100.0 /100 | #37 | Exceptional 19.4% |
| Bolivians | 100.0 /100 | #38 | Exceptional 19.3% |
| Immigrants | Spain | 100.0 /100 | #39 | Exceptional 19.1% |
| Immigrants | Bolivia | 100.0 /100 | #40 | Exceptional 19.1% |
| Immigrants | Latvia | 100.0 /100 | #41 | Exceptional 19.1% |
| Immigrants | Saudi Arabia | 100.0 /100 | #42 | Exceptional 19.0% |