Immigrants from Saudi Arabia vs Cuban 3rd Grade
COMPARE
Immigrants from Saudi Arabia
Cuban
3rd Grade
3rd Grade Comparison
Immigrants from Saudi Arabia
Cubans
98.0%
3RD GRADE
93.5/ 100
METRIC RATING
125th/ 347
METRIC RANK
97.3%
3RD GRADE
0.2/ 100
METRIC RATING
268th/ 347
METRIC RANK
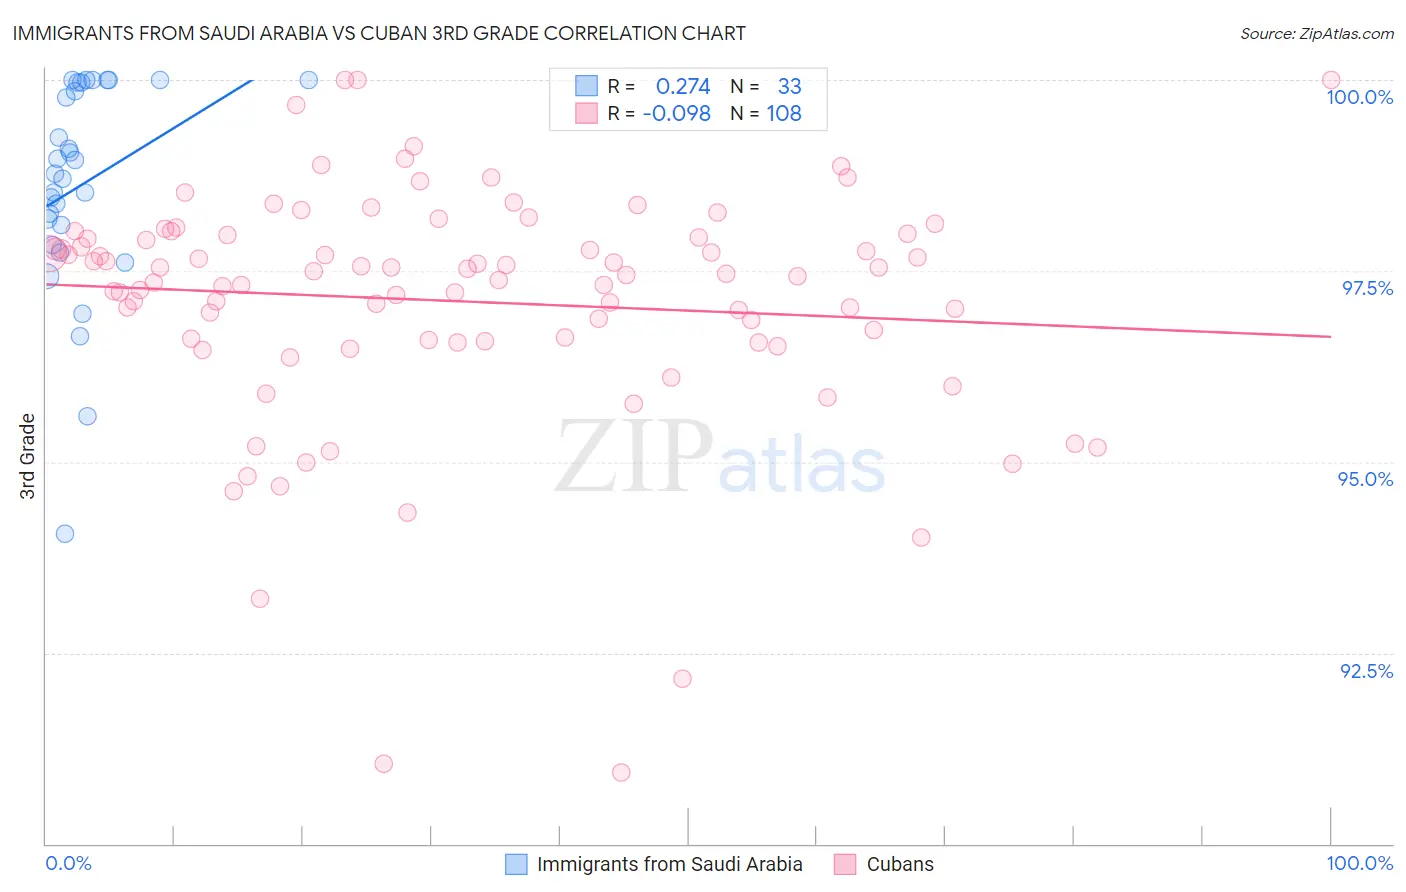
Immigrants from Saudi Arabia vs Cuban 3rd Grade Correlation Chart
The statistical analysis conducted on geographies consisting of 164,277,573 people shows a weak positive correlation between the proportion of Immigrants from Saudi Arabia and percentage of population with at least 3rd grade education in the United States with a correlation coefficient (R) of 0.274 and weighted average of 98.0%. Similarly, the statistical analysis conducted on geographies consisting of 449,326,865 people shows a slight negative correlation between the proportion of Cubans and percentage of population with at least 3rd grade education in the United States with a correlation coefficient (R) of -0.098 and weighted average of 97.3%, a difference of 0.74%.
3rd Grade Correlation Summary
| Measurement | Immigrants from Saudi Arabia | Cuban |
| Minimum | 94.1% | 90.9% |
| Maximum | 100.0% | 100.0% |
| Range | 5.9% | 9.1% |
| Mean | 98.6% | 97.1% |
| Median | 98.8% | 97.5% |
| Interquartile 25% (IQ1) | 98.0% | 96.6% |
| Interquartile 75% (IQ3) | 100.0% | 98.0% |
| Interquartile Range (IQR) | 2.0% | 1.4% |
| Standard Deviation (Sample) | 1.4% | 1.6% |
| Standard Deviation (Population) | 1.4% | 1.6% |
Similar Demographics by 3rd Grade
Demographics Similar to Immigrants from Saudi Arabia by 3rd Grade
In terms of 3rd grade, the demographic groups most similar to Immigrants from Saudi Arabia are Syrian (98.0%, a difference of 0.0%), Immigrants from Japan (98.0%, a difference of 0.0%), Immigrants from Zimbabwe (98.0%, a difference of 0.0%), Ute (98.0%, a difference of 0.0%), and Immigrants from Croatia (98.0%, a difference of 0.010%).
| Demographics | Rating | Rank | 3rd Grade |
| Iranians | 94.9 /100 | #118 | Exceptional 98.0% |
| Spanish | 94.8 /100 | #119 | Exceptional 98.0% |
| Immigrants | Croatia | 94.4 /100 | #120 | Exceptional 98.0% |
| Iroquois | 94.1 /100 | #121 | Exceptional 98.0% |
| Lebanese | 94.1 /100 | #122 | Exceptional 98.0% |
| Syrians | 93.8 /100 | #123 | Exceptional 98.0% |
| Immigrants | Japan | 93.7 /100 | #124 | Exceptional 98.0% |
| Immigrants | Saudi Arabia | 93.5 /100 | #125 | Exceptional 98.0% |
| Immigrants | Zimbabwe | 93.4 /100 | #126 | Exceptional 98.0% |
| Ute | 93.2 /100 | #127 | Exceptional 98.0% |
| Colville | 92.1 /100 | #128 | Exceptional 98.0% |
| Immigrants | Serbia | 91.9 /100 | #129 | Exceptional 98.0% |
| Immigrants | Europe | 91.2 /100 | #130 | Exceptional 98.0% |
| Immigrants | Bulgaria | 89.1 /100 | #131 | Excellent 97.9% |
| Immigrants | Hungary | 88.8 /100 | #132 | Excellent 97.9% |
Demographics Similar to Cubans by 3rd Grade
In terms of 3rd grade, the demographic groups most similar to Cubans are Fijian (97.3%, a difference of 0.0%), Yaqui (97.3%, a difference of 0.010%), Immigrants from Nigeria (97.3%, a difference of 0.010%), Immigrants from Jamaica (97.3%, a difference of 0.020%), and Taiwanese (97.3%, a difference of 0.030%).
| Demographics | Rating | Rank | 3rd Grade |
| Immigrants | South America | 0.4 /100 | #261 | Tragic 97.3% |
| Immigrants | Sierra Leone | 0.4 /100 | #262 | Tragic 97.3% |
| Taiwanese | 0.3 /100 | #263 | Tragic 97.3% |
| West Indians | 0.3 /100 | #264 | Tragic 97.3% |
| Immigrants | Jamaica | 0.3 /100 | #265 | Tragic 97.3% |
| Yaqui | 0.3 /100 | #266 | Tragic 97.3% |
| Immigrants | Nigeria | 0.3 /100 | #267 | Tragic 97.3% |
| Cubans | 0.2 /100 | #268 | Tragic 97.3% |
| Fijians | 0.2 /100 | #269 | Tragic 97.3% |
| Immigrants | China | 0.2 /100 | #270 | Tragic 97.2% |
| Puerto Ricans | 0.2 /100 | #271 | Tragic 97.2% |
| Ghanaians | 0.1 /100 | #272 | Tragic 97.2% |
| Immigrants | Peru | 0.1 /100 | #273 | Tragic 97.2% |
| Immigrants | Cameroon | 0.1 /100 | #274 | Tragic 97.2% |
| Immigrants | Uzbekistan | 0.1 /100 | #275 | Tragic 97.2% |