Immigrants from Romania vs Zimbabwean Doctorate Degree
COMPARE
Immigrants from Romania
Zimbabwean
Doctorate Degree
Doctorate Degree Comparison
Immigrants from Romania
Zimbabweans
2.1%
DOCTORATE DEGREE
98.7/ 100
METRIC RATING
95th/ 347
METRIC RANK
2.3%
DOCTORATE DEGREE
99.8/ 100
METRIC RATING
67th/ 347
METRIC RANK
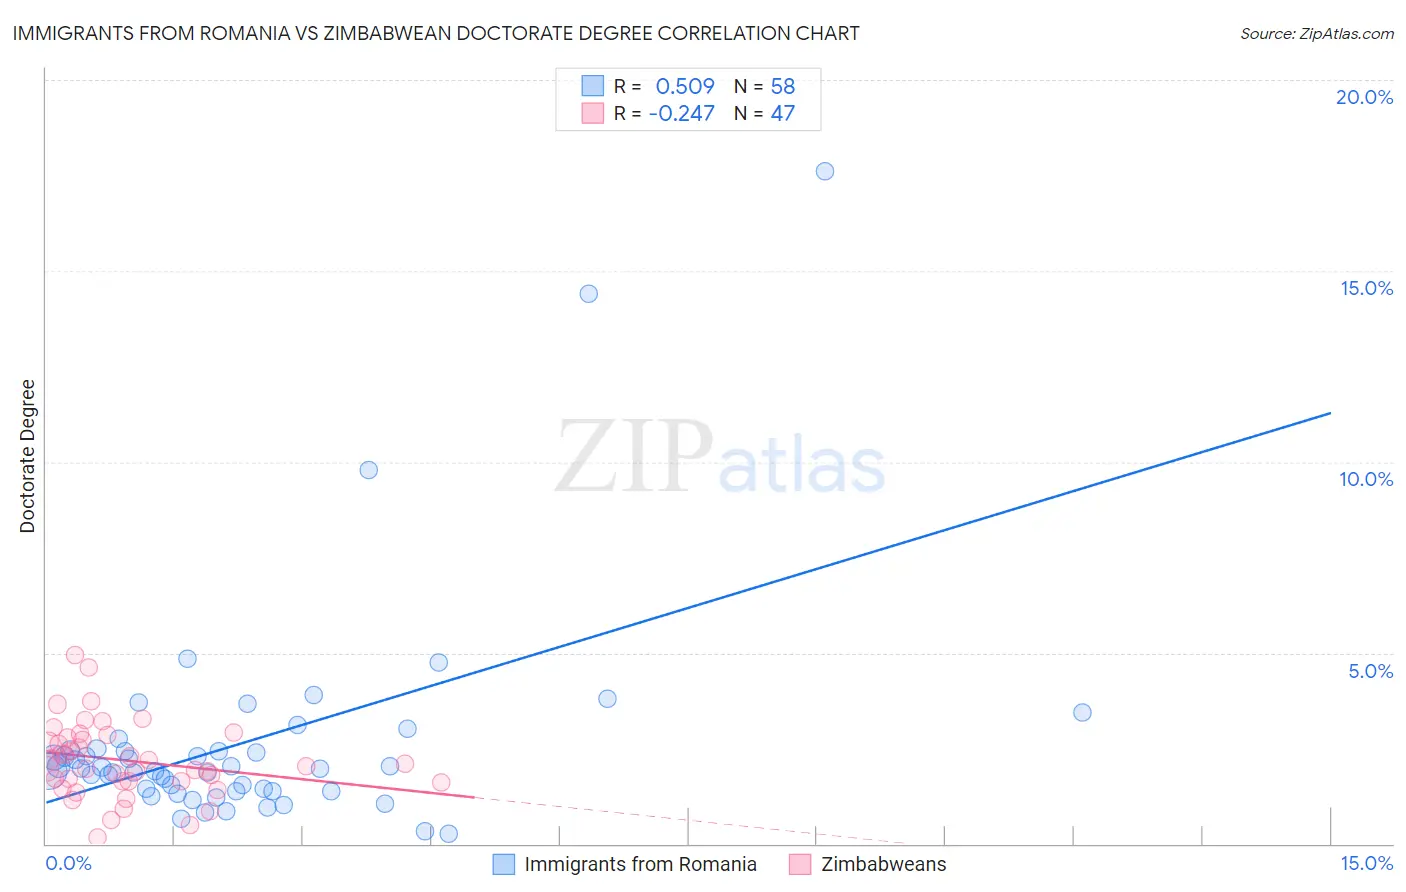
Immigrants from Romania vs Zimbabwean Doctorate Degree Correlation Chart
The statistical analysis conducted on geographies consisting of 256,246,165 people shows a substantial positive correlation between the proportion of Immigrants from Romania and percentage of population with at least doctorate degree education in the United States with a correlation coefficient (R) of 0.509 and weighted average of 2.1%. Similarly, the statistical analysis conducted on geographies consisting of 69,036,010 people shows a weak negative correlation between the proportion of Zimbabweans and percentage of population with at least doctorate degree education in the United States with a correlation coefficient (R) of -0.247 and weighted average of 2.3%, a difference of 6.6%.
Doctorate Degree Correlation Summary
| Measurement | Immigrants from Romania | Zimbabwean |
| Minimum | 0.25% | 0.16% |
| Maximum | 17.6% | 4.9% |
| Range | 17.4% | 4.8% |
| Mean | 2.7% | 2.2% |
| Median | 2.0% | 2.0% |
| Interquartile 25% (IQ1) | 1.4% | 1.6% |
| Interquartile 75% (IQ3) | 2.4% | 2.8% |
| Interquartile Range (IQR) | 1.1% | 1.2% |
| Standard Deviation (Sample) | 2.9% | 0.98% |
| Standard Deviation (Population) | 2.9% | 0.97% |
Similar Demographics by Doctorate Degree
Demographics Similar to Immigrants from Romania by Doctorate Degree
In terms of doctorate degree, the demographic groups most similar to Immigrants from Romania are Greek (2.1%, a difference of 0.15%), Immigrants from Northern Africa (2.1%, a difference of 0.59%), Immigrants from Eritrea (2.1%, a difference of 0.72%), Alsatian (2.1%, a difference of 0.78%), and Armenian (2.1%, a difference of 0.80%).
| Demographics | Rating | Rank | Doctorate Degree |
| Immigrants | Nepal | 99.3 /100 | #88 | Exceptional 2.2% |
| British | 99.3 /100 | #89 | Exceptional 2.2% |
| Immigrants | Scotland | 99.2 /100 | #90 | Exceptional 2.2% |
| Immigrants | Sudan | 99.1 /100 | #91 | Exceptional 2.2% |
| Chileans | 99.1 /100 | #92 | Exceptional 2.2% |
| Alsatians | 99.0 /100 | #93 | Exceptional 2.1% |
| Greeks | 98.8 /100 | #94 | Exceptional 2.1% |
| Immigrants | Romania | 98.7 /100 | #95 | Exceptional 2.1% |
| Immigrants | Northern Africa | 98.4 /100 | #96 | Exceptional 2.1% |
| Immigrants | Eritrea | 98.4 /100 | #97 | Exceptional 2.1% |
| Armenians | 98.3 /100 | #98 | Exceptional 2.1% |
| Immigrants | Egypt | 98.2 /100 | #99 | Exceptional 2.1% |
| Immigrants | Eastern Europe | 98.2 /100 | #100 | Exceptional 2.1% |
| Immigrants | Eastern Africa | 98.2 /100 | #101 | Exceptional 2.1% |
| Immigrants | Chile | 98.1 /100 | #102 | Exceptional 2.1% |
Demographics Similar to Zimbabweans by Doctorate Degree
In terms of doctorate degree, the demographic groups most similar to Zimbabweans are Immigrants from Kazakhstan (2.3%, a difference of 0.23%), Argentinean (2.3%, a difference of 0.46%), Carpatho Rusyn (2.3%, a difference of 0.48%), Lithuanian (2.3%, a difference of 0.62%), and Immigrants from Bolivia (2.3%, a difference of 0.62%).
| Demographics | Rating | Rank | Doctorate Degree |
| Immigrants | Serbia | 99.9 /100 | #60 | Exceptional 2.3% |
| Bhutanese | 99.9 /100 | #61 | Exceptional 2.3% |
| Immigrants | Europe | 99.9 /100 | #62 | Exceptional 2.3% |
| Laotians | 99.9 /100 | #63 | Exceptional 2.3% |
| Immigrants | Greece | 99.9 /100 | #64 | Exceptional 2.3% |
| Paraguayans | 99.9 /100 | #65 | Exceptional 2.3% |
| Argentineans | 99.9 /100 | #66 | Exceptional 2.3% |
| Zimbabweans | 99.8 /100 | #67 | Exceptional 2.3% |
| Immigrants | Kazakhstan | 99.8 /100 | #68 | Exceptional 2.3% |
| Carpatho Rusyns | 99.8 /100 | #69 | Exceptional 2.3% |
| Lithuanians | 99.8 /100 | #70 | Exceptional 2.3% |
| Immigrants | Bolivia | 99.8 /100 | #71 | Exceptional 2.3% |
| Immigrants | Canada | 99.8 /100 | #72 | Exceptional 2.3% |
| Immigrants | Bulgaria | 99.8 /100 | #73 | Exceptional 2.3% |
| Immigrants | North America | 99.8 /100 | #74 | Exceptional 2.2% |