Immigrants from Romania vs Laotian 4th Grade

COMPARE

Immigrants from Romania
Race
Ancestry
AfghanAfricanAlaska NativeAlaskan AthabascanAlbanianAleutAlsatianAmericanApacheArabArapahoArgentineanArmenianAssyrian/Chaldean/SyriacAustralianAustrianBahamianBangladeshiBarbadianBasqueBelgianBelizeanBermudanBhutaneseBlackfeetBolivianBrazilianBritishBritish West IndianBulgarianBurmeseCajunCambodianCanadianCape VerdeanCarpatho RusynCelticCentral AmericanCentral American IndianCherokeeCheyenneChickasawChileanChineseChippewaChoctawColombianColvilleComancheCosta RicanCreeCreekCroatianCrowCubanCypriotCzechCzechoslovakianDanishDelawareDominicanDutchDutch West IndianEastern EuropeanEcuadorianEgyptianEnglishEstonianEthiopianEuropeanFijianFilipinoFinnishFrenchFrench American IndianFrench CanadianGermanGerman RussianGhanaianGreekGuamanian/ChamorroGuatemalanGuyaneseHaitianHmongHonduranHopiHoumaHungarianIcelanderIndian (Asian)IndonesianInupiatIranianIraqiIrishIroquoisIsraeliItalianJamaicanJapaneseJordanianKenyanKiowaKoreanLatvianLebaneseLiberianLithuanianLumbeeLuxembourgerMacedonianMalaysianMalteseMarshalleseMenomineeMexicanMexican American IndianMongolianMoroccanNative HawaiianNavajoNepaleseNew ZealanderNicaraguanNigerianNorthern EuropeanNorwegianOkinawanOsageOttawaPaiutePakistaniPalestinianPanamanianParaguayanPennsylvania GermanPeruvianPimaPolishPortuguesePotawatomiPuebloPuerto RicanPuget Sound SalishRomanianRussianSalvadoranSamoanScandinavianScotch-IrishScottishSeminoleSenegaleseSerbianShoshoneSierra LeoneanSiouxSlavicSlovakSloveneSomaliSouth AfricanSouth AmericanSouth American IndianSoviet UnionSpaniardSpanishSpanish AmericanSpanish American IndianSri LankanSubsaharan AfricanSudaneseSwedishSwissSyrianTaiwaneseThaiTlingit-HaidaTohono O'OdhamTonganTrinidadian and TobagonianTsimshianTurkishU.S. Virgin IslanderUgandanUkrainianUruguayanUteVenezuelanVietnameseWelshWest IndianYakamaYaquiYugoslavianYumanYup'ikZimbabwean
Immigration
NonimmigrantsImmigrantsAfghanistanAfricaAlbaniaArgentinaArmeniaAsiaAustraliaAustriaBahamasBangladeshBarbadosBelarusBelgiumBelizeBoliviaBosnia and HerzegovinaBrazilBulgariaBurma/MyanmarCabo VerdeCambodiaCameroonCanadaCaribbeanCentral AmericaChileChinaColombiaCongoCosta RicaCroatiaCubaCzechoslovakiaDenmarkDominicaDominican RepublicEastern AfricaEastern AsiaEastern EuropeEcuadorEgyptEl SalvadorEnglandEritreaEthiopiaEuropeFijiFranceGermanyGhanaGreeceGrenadaGuatemalaGuyanaHaitiHondurasHong KongHungaryIndiaIndonesiaIranIraqIrelandIsraelItalyJamaicaJapanJordanKazakhstanKenyaKoreaKuwaitLaosLatin AmericaLatviaLebanonLiberiaLithuaniaMalaysiaMexicoMicronesiaMiddle AfricaMoldovaMoroccoNepalNetherlandsNicaraguaNigeriaNorth AmericaNorth MacedoniaNorthern AfricaNorthern EuropeNorwayOceaniaPakistanPanamaPeruPhilippinesPolandPortugalRomaniaRussiaSaudi ArabiaScotlandSenegalSerbiaSierra LeoneSingaporeSomaliaSouth AfricaSouth AmericaSouth Central AsiaSouth Eastern AsiaSouthern EuropeSpainSri LankaSt. Vincent and the GrenadinesSudanSwedenSwitzerlandSyriaTaiwanThailandTrinidad and TobagoTurkeyUgandaUkraineUruguayUzbekistanVenezuelaVietnamWest IndiesWestern AfricaWestern AsiaWestern EuropeYemenZaireZimbabweAzores
Laotian
Race
Ancestry
AfghanAfricanAlaska NativeAlaskan AthabascanAlbanianAleutAlsatianAmericanApacheArabArapahoArgentineanArmenianAssyrian/Chaldean/SyriacAustralianAustrianBahamianBangladeshiBarbadianBasqueBelgianBelizeanBermudanBhutaneseBlackfeetBolivianBrazilianBritishBritish West IndianBulgarianBurmeseCajunCambodianCanadianCape VerdeanCarpatho RusynCelticCentral AmericanCentral American IndianCherokeeCheyenneChickasawChileanChineseChippewaChoctawColombianColvilleComancheCosta RicanCreeCreekCroatianCrowCubanCypriotCzechCzechoslovakianDanishDelawareDominicanDutchDutch West IndianEastern EuropeanEcuadorianEgyptianEnglishEstonianEthiopianEuropeanFijianFilipinoFinnishFrenchFrench American IndianFrench CanadianGermanGerman RussianGhanaianGreekGuamanian/ChamorroGuatemalanGuyaneseHaitianHmongHonduranHopiHoumaHungarianIcelanderIndian (Asian)IndonesianInupiatIranianIraqiIrishIroquoisIsraeliItalianJamaicanJapaneseJordanianKenyanKiowaKoreanLaotianLatvianLebaneseLiberianLithuanianLumbeeLuxembourgerMacedonianMalaysianMalteseMarshalleseMenomineeMexicanMexican American IndianMongolianMoroccanNative HawaiianNavajoNepaleseNew ZealanderNicaraguanNigerianNorthern EuropeanNorwegianOkinawanOsageOttawaPaiutePakistaniPalestinianPanamanianParaguayanPennsylvania GermanPeruvianPimaPolishPortuguesePotawatomiPuebloPuerto RicanPuget Sound SalishRomanianRussianSalvadoranSamoanScandinavianScotch-IrishScottishSeminoleSenegaleseSerbianShoshoneSierra LeoneanSiouxSlavicSlovakSloveneSomaliSouth AfricanSouth AmericanSouth American IndianSoviet UnionSpaniardSpanishSpanish AmericanSpanish American IndianSri LankanSubsaharan AfricanSudaneseSwedishSwissSyrianTaiwaneseThaiTlingit-HaidaTohono O'OdhamTonganTrinidadian and TobagonianTsimshianTurkishU.S. Virgin IslanderUgandanUkrainianUruguayanUteVenezuelanVietnameseWelshWest IndianYakamaYaquiYugoslavianYumanYup'ikZimbabwean
Immigration
NonimmigrantsImmigrantsAfghanistanAfricaAlbaniaArgentinaArmeniaAsiaAustraliaAustriaBahamasBangladeshBarbadosBelarusBelgiumBelizeBoliviaBosnia and HerzegovinaBrazilBulgariaBurma/MyanmarCabo VerdeCambodiaCameroonCanadaCaribbeanCentral AmericaChileChinaColombiaCongoCosta RicaCroatiaCubaCzechoslovakiaDenmarkDominicaDominican RepublicEastern AfricaEastern AsiaEastern EuropeEcuadorEgyptEl SalvadorEnglandEritreaEthiopiaEuropeFijiFranceGermanyGhanaGreeceGrenadaGuatemalaGuyanaHaitiHondurasHong KongHungaryIndiaIndonesiaIranIraqIrelandIsraelItalyJamaicaJapanJordanKazakhstanKenyaKoreaKuwaitLaosLatin AmericaLatviaLebanonLiberiaLithuaniaMalaysiaMexicoMicronesiaMiddle AfricaMoldovaMoroccoNepalNetherlandsNicaraguaNigeriaNorth AmericaNorth MacedoniaNorthern AfricaNorthern EuropeNorwayOceaniaPakistanPanamaPeruPhilippinesPolandPortugalRussiaSaudi ArabiaScotlandSenegalSerbiaSierra LeoneSingaporeSomaliaSouth AfricaSouth AmericaSouth Central AsiaSouth Eastern AsiaSouthern EuropeSpainSri LankaSt. Vincent and the GrenadinesSudanSwedenSwitzerlandSyriaTaiwanThailandTrinidad and TobagoTurkeyUgandaUkraineUruguayUzbekistanVenezuelaVietnamWest IndiesWestern AfricaWestern AsiaWestern EuropeYemenZaireZimbabweAzores
4th Grade
Income
Poverty
Unemployment
Labor Participation
Family Structure
Vehicle Availability
Education Level
Disability

4th Grade Comparison

Immigrants from Romania

Laotians

Exceptional
Tragic
97.7%
4TH GRADE
90.6/ 100
METRIC RATING
130th/ 347
METRIC RANK
97.3%
4TH GRADE
9.3/ 100
METRIC RATING
209th/ 347
METRIC RANK

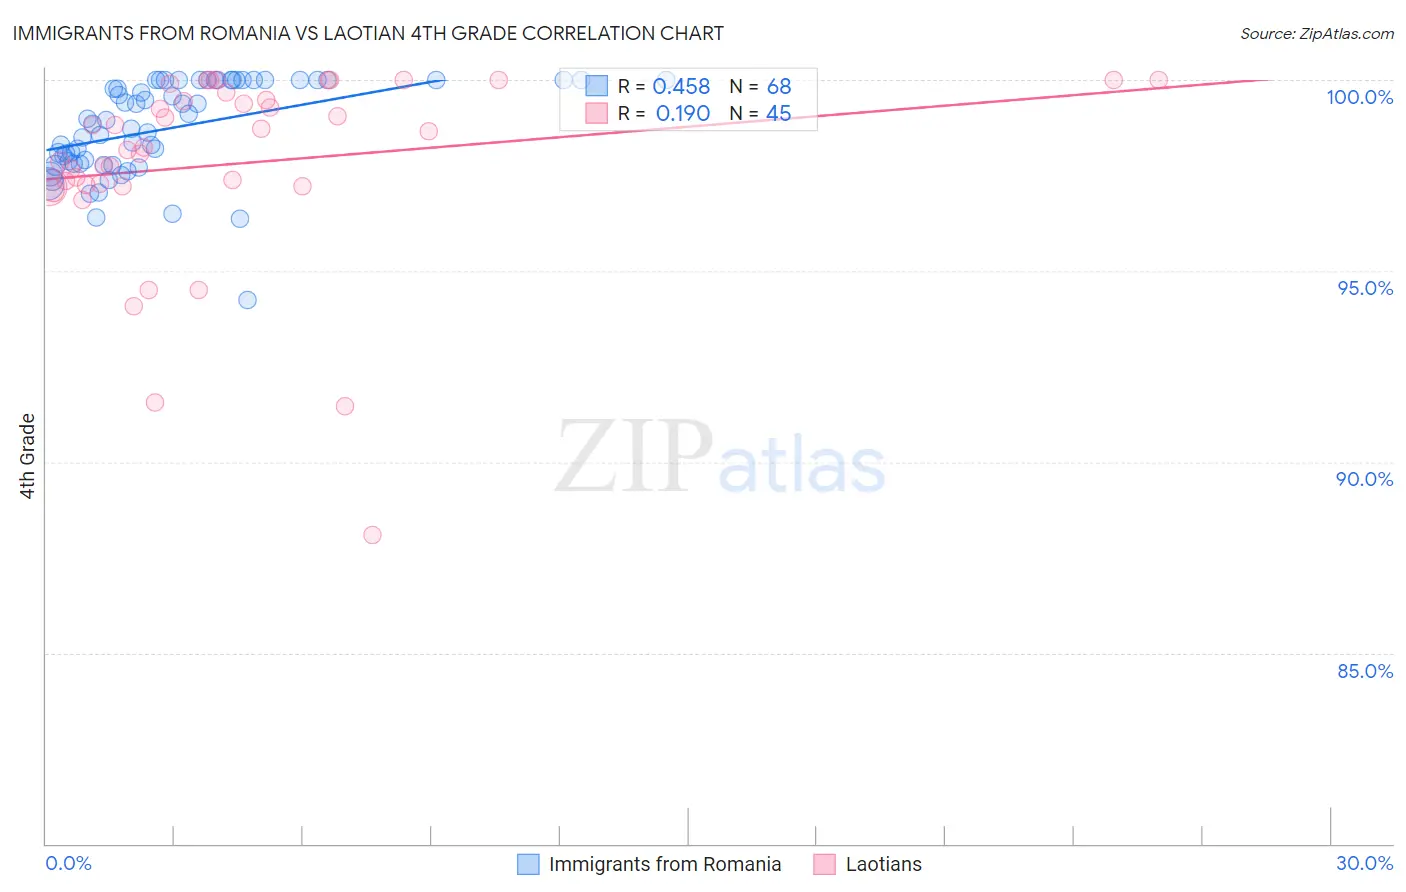
Immigrants from Romania vs Laotian 4th Grade Correlation Chart

The statistical analysis conducted on geographies consisting of 257,007,131 people shows a moderate positive correlation between the proportion of Immigrants from Romania and percentage of population with at least 4th grade education in the United States with a correlation coefficient (R) of 0.458 and weighted average of 97.7%. Similarly, the statistical analysis conducted on geographies consisting of 224,856,886 people shows a poor positive correlation between the proportion of Laotians and percentage of population with at least 4th grade education in the United States with a correlation coefficient (R) of 0.190 and weighted average of 97.3%, a difference of 0.43%.
Immigrants from Romania vs Laotian 4th Grade

4th Grade Correlation Summary

MeasurementImmigrants from RomaniaLaotian
Minimum94.3%88.1%
Maximum100.0%100.0%
Range5.7%11.9%
Mean98.7%97.8%
Median98.9%98.2%
Interquartile 25% (IQ1)97.8%97.2%
Interquartile 75% (IQ3)100.0%99.6%
Interquartile Range (IQR)2.2%2.3%
Standard Deviation (Sample)1.2%2.5%
Standard Deviation (Population)1.2%2.5%

Similar Demographics by 4th Grade

Demographics Similar to Immigrants from Romania by 4th Grade

In terms of 4th grade, the demographic groups most similar to Immigrants from Romania are Immigrants from Bulgaria (97.7%, a difference of 0.010%), Immigrants from Kuwait (97.7%, a difference of 0.010%), Immigrants from Hungary (97.7%, a difference of 0.010%), Immigrants from Europe (97.8%, a difference of 0.020%), and Colville (97.7%, a difference of 0.020%).
DemographicsRating | Rank4th Grade
Immigrants | Zimbabwe
93.9
/100
|
#123
Exceptional
97.8%
Spanish
93.7
/100
|
#124
Exceptional
97.8%
Immigrants | Serbia
92.6
/100
|
#125
Exceptional
97.8%
Immigrants | Europe
92.5
/100
|
#126
Exceptional
97.8%
Colville
92.3
/100
|
#127
Exceptional
97.7%
Pima
92.0
/100
|
#128
Exceptional
97.7%
Immigrants | Bulgaria
91.3
/100
|
#129
Exceptional
97.7%
Immigrants | Romania
90.6
/100
|
#130
Exceptional
97.7%
Immigrants | Kuwait
89.7
/100
|
#131
Excellent
97.7%
Immigrants | Hungary
89.3
/100
|
#132
Excellent
97.7%
Hmong
88.2
/100
|
#133
Excellent
97.7%
Palestinians
88.1
/100
|
#134
Excellent
97.7%
Cambodians
87.8
/100
|
#135
Excellent
97.7%
Israelis
86.2
/100
|
#136
Excellent
97.7%
Immigrants | Turkey
86.0
/100
|
#137
Excellent
97.7%

Demographics Similar to Laotians by 4th Grade

In terms of 4th grade, the demographic groups most similar to Laotians are Immigrants from Oceania (97.3%, a difference of 0.0%), Sudanese (97.3%, a difference of 0.0%), Tohono O'odham (97.3%, a difference of 0.010%), Costa Rican (97.3%, a difference of 0.010%), and Moroccan (97.3%, a difference of 0.020%).
DemographicsRating | Rank4th Grade
Immigrants | Chile
16.1
/100
|
#202
Poor
97.4%
Immigrants | Northern Africa
15.1
/100
|
#203
Poor
97.4%
Africans
14.6
/100
|
#204
Poor
97.4%
Paiute
13.2
/100
|
#205
Poor
97.3%
Immigrants | Zaire
12.8
/100
|
#206
Poor
97.3%
Moroccans
11.3
/100
|
#207
Poor
97.3%
Immigrants | Bahamas
10.8
/100
|
#208
Poor
97.3%
Laotians
9.3
/100
|
#209
Tragic
97.3%
Immigrants | Oceania
9.1
/100
|
#210
Tragic
97.3%
Sudanese
9.0
/100
|
#211
Tragic
97.3%
Tohono O'odham
8.4
/100
|
#212
Tragic
97.3%
Costa Ricans
8.3
/100
|
#213
Tragic
97.3%
Immigrants | Nepal
7.7
/100
|
#214
Tragic
97.3%
Immigrants | Morocco
7.1
/100
|
#215
Tragic
97.3%
Samoans
6.8
/100
|
#216
Tragic
97.3%