Immigrants from Romania vs German Associate's Degree
COMPARE
Immigrants from Romania
German
Associate's Degree
Associate's Degree Comparison
Immigrants from Romania
Germans
50.9%
ASSOCIATE'S DEGREE
99.5/ 100
METRIC RATING
71st/ 347
METRIC RANK
45.5%
ASSOCIATE'S DEGREE
26.5/ 100
METRIC RATING
195th/ 347
METRIC RANK
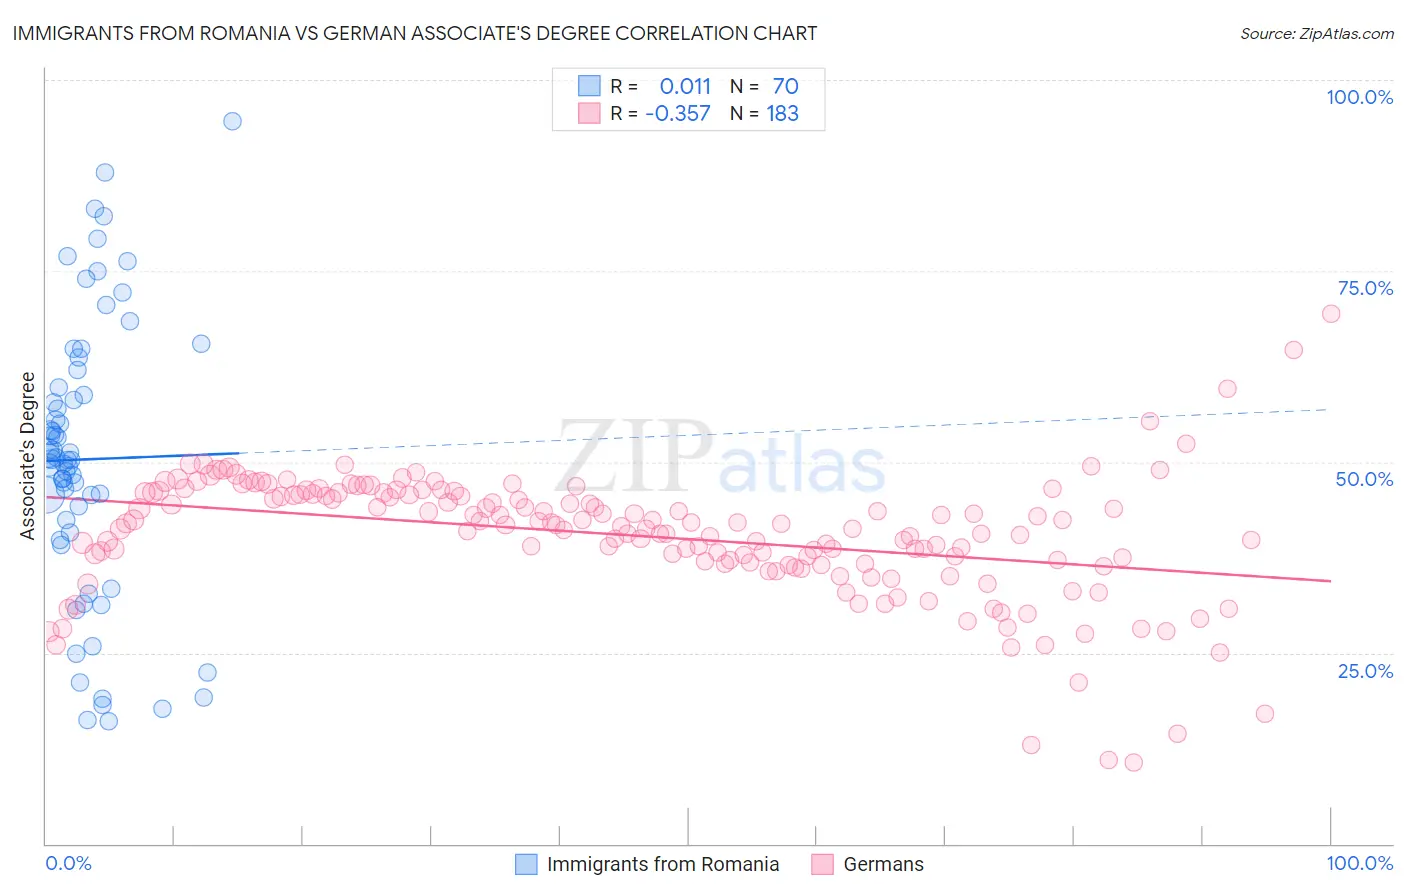
Immigrants from Romania vs German Associate's Degree Correlation Chart
The statistical analysis conducted on geographies consisting of 257,014,107 people shows no correlation between the proportion of Immigrants from Romania and percentage of population with at least associate's degree education in the United States with a correlation coefficient (R) of 0.011 and weighted average of 50.9%. Similarly, the statistical analysis conducted on geographies consisting of 581,143,634 people shows a mild negative correlation between the proportion of Germans and percentage of population with at least associate's degree education in the United States with a correlation coefficient (R) of -0.357 and weighted average of 45.5%, a difference of 12.0%.
Associate's Degree Correlation Summary
| Measurement | Immigrants from Romania | German |
| Minimum | 16.1% | 10.6% |
| Maximum | 94.5% | 69.4% |
| Range | 78.4% | 58.8% |
| Mean | 50.3% | 40.3% |
| Median | 50.3% | 41.8% |
| Interquartile 25% (IQ1) | 40.7% | 36.7% |
| Interquartile 75% (IQ3) | 59.7% | 45.9% |
| Interquartile Range (IQR) | 19.1% | 9.2% |
| Standard Deviation (Sample) | 18.2% | 8.3% |
| Standard Deviation (Population) | 18.1% | 8.3% |
Similar Demographics by Associate's Degree
Demographics Similar to Immigrants from Romania by Associate's Degree
In terms of associate's degree, the demographic groups most similar to Immigrants from Romania are Immigrants from Argentina (50.9%, a difference of 0.010%), Egyptian (50.9%, a difference of 0.040%), Immigrants from Pakistan (50.9%, a difference of 0.060%), Immigrants from Indonesia (51.0%, a difference of 0.16%), and Carpatho Rusyn (50.6%, a difference of 0.53%).
| Demographics | Rating | Rank | Associate's Degree |
| Immigrants | Netherlands | 99.7 /100 | #64 | Exceptional 51.4% |
| Zimbabweans | 99.7 /100 | #65 | Exceptional 51.3% |
| Immigrants | Europe | 99.7 /100 | #66 | Exceptional 51.3% |
| Argentineans | 99.6 /100 | #67 | Exceptional 51.2% |
| Immigrants | Indonesia | 99.5 /100 | #68 | Exceptional 51.0% |
| Egyptians | 99.5 /100 | #69 | Exceptional 50.9% |
| Immigrants | Argentina | 99.5 /100 | #70 | Exceptional 50.9% |
| Immigrants | Romania | 99.5 /100 | #71 | Exceptional 50.9% |
| Immigrants | Pakistan | 99.5 /100 | #72 | Exceptional 50.9% |
| Carpatho Rusyns | 99.3 /100 | #73 | Exceptional 50.6% |
| Lithuanians | 99.3 /100 | #74 | Exceptional 50.6% |
| Immigrants | Scotland | 99.3 /100 | #75 | Exceptional 50.6% |
| Immigrants | Zimbabwe | 99.2 /100 | #76 | Exceptional 50.5% |
| Immigrants | Lebanon | 99.1 /100 | #77 | Exceptional 50.5% |
| Immigrants | Eastern Europe | 99.1 /100 | #78 | Exceptional 50.5% |
Demographics Similar to Germans by Associate's Degree
In terms of associate's degree, the demographic groups most similar to Germans are French (45.4%, a difference of 0.090%), Immigrants from Peru (45.5%, a difference of 0.10%), Immigrants from Cameroon (45.7%, a difference of 0.42%), Scotch-Irish (45.3%, a difference of 0.44%), and Immigrants from Bangladesh (45.2%, a difference of 0.54%).
| Demographics | Rating | Rank | Associate's Degree |
| Ghanaians | 35.5 /100 | #188 | Fair 45.8% |
| Immigrants | Oceania | 34.7 /100 | #189 | Fair 45.8% |
| Vietnamese | 34.0 /100 | #190 | Fair 45.8% |
| Koreans | 33.8 /100 | #191 | Fair 45.8% |
| Celtics | 33.3 /100 | #192 | Fair 45.8% |
| Immigrants | Cameroon | 31.0 /100 | #193 | Fair 45.7% |
| Immigrants | Peru | 27.6 /100 | #194 | Fair 45.5% |
| Germans | 26.5 /100 | #195 | Fair 45.5% |
| French | 25.6 /100 | #196 | Fair 45.4% |
| Scotch-Irish | 22.3 /100 | #197 | Fair 45.3% |
| Immigrants | Bangladesh | 21.3 /100 | #198 | Fair 45.2% |
| Immigrants | Senegal | 21.2 /100 | #199 | Fair 45.2% |
| Senegalese | 21.1 /100 | #200 | Fair 45.2% |
| Immigrants | Vietnam | 20.8 /100 | #201 | Fair 45.2% |
| Spaniards | 20.4 /100 | #202 | Fair 45.2% |