Immigrants from Portugal vs Seminole Doctorate Degree
COMPARE
Immigrants from Portugal
Seminole
Doctorate Degree
Doctorate Degree Comparison
Immigrants from Portugal
Seminole
1.5%
DOCTORATE DEGREE
0.8/ 100
METRIC RATING
261st/ 347
METRIC RANK
1.3%
DOCTORATE DEGREE
0.1/ 100
METRIC RATING
322nd/ 347
METRIC RANK
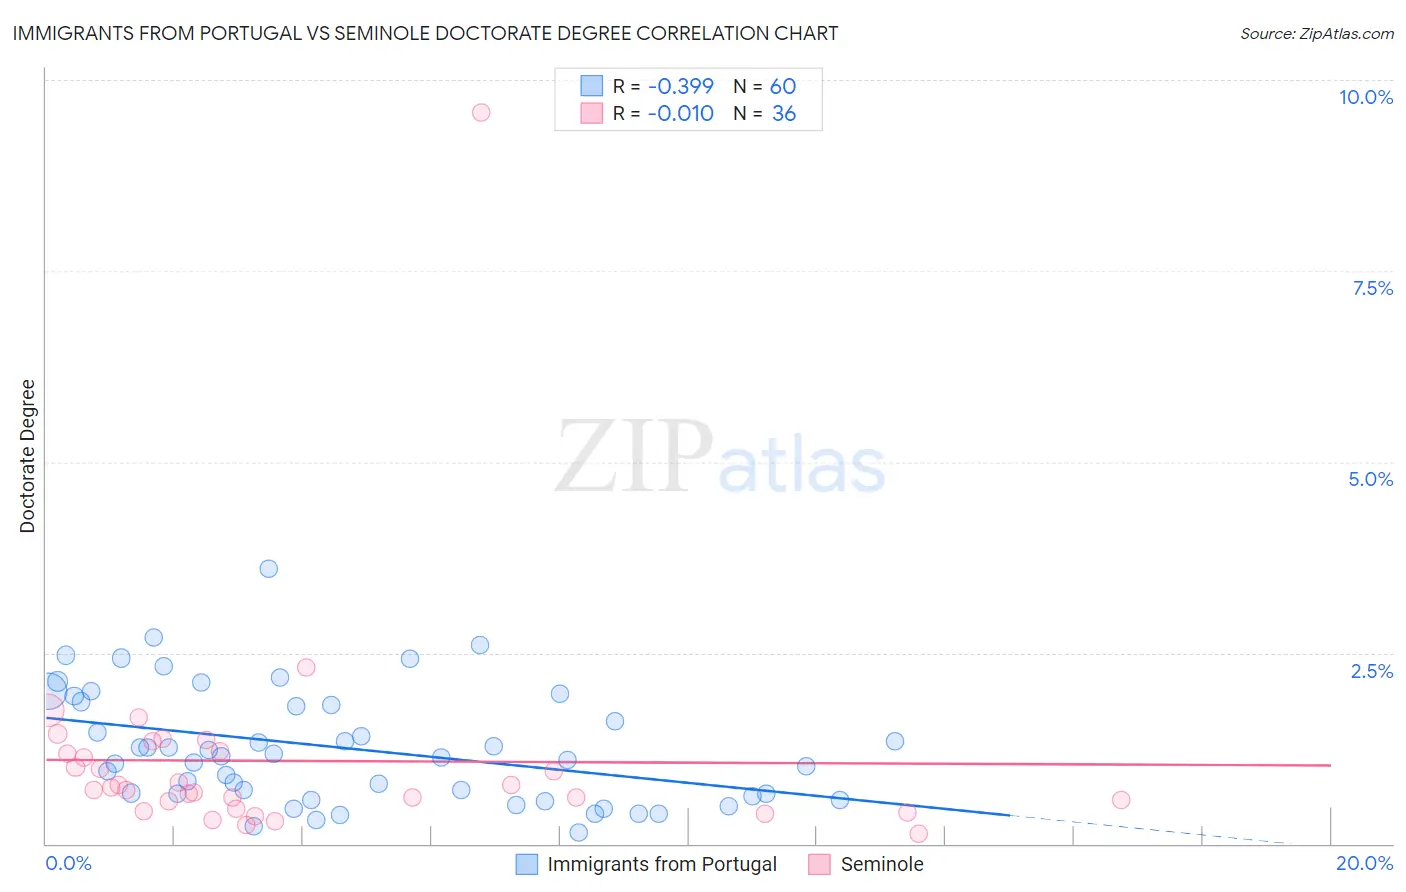
Immigrants from Portugal vs Seminole Doctorate Degree Correlation Chart
The statistical analysis conducted on geographies consisting of 173,995,851 people shows a mild negative correlation between the proportion of Immigrants from Portugal and percentage of population with at least doctorate degree education in the United States with a correlation coefficient (R) of -0.399 and weighted average of 1.5%. Similarly, the statistical analysis conducted on geographies consisting of 117,553,493 people shows no correlation between the proportion of Seminole and percentage of population with at least doctorate degree education in the United States with a correlation coefficient (R) of -0.010 and weighted average of 1.3%, a difference of 13.6%.
Doctorate Degree Correlation Summary
| Measurement | Immigrants from Portugal | Seminole |
| Minimum | 0.14% | 0.13% |
| Maximum | 3.6% | 9.6% |
| Range | 3.5% | 9.4% |
| Mean | 1.2% | 1.1% |
| Median | 1.1% | 0.72% |
| Interquartile 25% (IQ1) | 0.64% | 0.51% |
| Interquartile 75% (IQ3) | 1.8% | 1.2% |
| Interquartile Range (IQR) | 1.2% | 0.69% |
| Standard Deviation (Sample) | 0.75% | 1.5% |
| Standard Deviation (Population) | 0.75% | 1.5% |
Similar Demographics by Doctorate Degree
Demographics Similar to Immigrants from Portugal by Doctorate Degree
In terms of doctorate degree, the demographic groups most similar to Immigrants from Portugal are Chickasaw (1.5%, a difference of 0.15%), Immigrants from Bahamas (1.5%, a difference of 0.32%), Japanese (1.5%, a difference of 0.46%), Blackfeet (1.5%, a difference of 0.51%), and Liberian (1.5%, a difference of 0.56%).
| Demographics | Rating | Rank | Doctorate Degree |
| Immigrants | Cambodia | 1.0 /100 | #254 | Tragic 1.5% |
| Trinidadians and Tobagonians | 1.0 /100 | #255 | Tragic 1.5% |
| Central American Indians | 1.0 /100 | #256 | Tragic 1.5% |
| Chippewa | 0.9 /100 | #257 | Tragic 1.5% |
| Immigrants | West Indies | 0.9 /100 | #258 | Tragic 1.5% |
| Liberians | 0.9 /100 | #259 | Tragic 1.5% |
| Japanese | 0.9 /100 | #260 | Tragic 1.5% |
| Immigrants | Portugal | 0.8 /100 | #261 | Tragic 1.5% |
| Chickasaw | 0.7 /100 | #262 | Tragic 1.5% |
| Immigrants | Bahamas | 0.7 /100 | #263 | Tragic 1.5% |
| Blackfeet | 0.7 /100 | #264 | Tragic 1.5% |
| Nicaraguans | 0.6 /100 | #265 | Tragic 1.5% |
| Immigrants | Liberia | 0.5 /100 | #266 | Tragic 1.5% |
| Kiowa | 0.5 /100 | #267 | Tragic 1.5% |
| U.S. Virgin Islanders | 0.5 /100 | #268 | Tragic 1.5% |
Demographics Similar to Seminole by Doctorate Degree
In terms of doctorate degree, the demographic groups most similar to Seminole are Dutch West Indian (1.3%, a difference of 0.060%), Immigrants from St. Vincent and the Grenadines (1.3%, a difference of 0.16%), Immigrants from Belize (1.3%, a difference of 0.20%), Immigrants from Guyana (1.3%, a difference of 0.23%), and Native/Alaskan (1.3%, a difference of 0.52%).
| Demographics | Rating | Rank | Doctorate Degree |
| Immigrants | Azores | 0.1 /100 | #315 | Tragic 1.4% |
| Navajo | 0.1 /100 | #316 | Tragic 1.4% |
| Immigrants | Micronesia | 0.1 /100 | #317 | Tragic 1.3% |
| Creek | 0.1 /100 | #318 | Tragic 1.3% |
| Immigrants | Guyana | 0.1 /100 | #319 | Tragic 1.3% |
| Immigrants | St. Vincent and the Grenadines | 0.1 /100 | #320 | Tragic 1.3% |
| Dutch West Indians | 0.1 /100 | #321 | Tragic 1.3% |
| Seminole | 0.1 /100 | #322 | Tragic 1.3% |
| Immigrants | Belize | 0.1 /100 | #323 | Tragic 1.3% |
| Natives/Alaskans | 0.0 /100 | #324 | Tragic 1.3% |
| Pima | 0.0 /100 | #325 | Tragic 1.3% |
| Immigrants | Cabo Verde | 0.0 /100 | #326 | Tragic 1.3% |
| Hispanics or Latinos | 0.0 /100 | #327 | Tragic 1.3% |
| Inupiat | 0.0 /100 | #328 | Tragic 1.3% |
| Haitians | 0.0 /100 | #329 | Tragic 1.3% |