Immigrants from Portugal vs Osage 6th Grade
COMPARE
Immigrants from Portugal
Osage
6th Grade
6th Grade Comparison
Immigrants from Portugal
Osage
95.5%
6TH GRADE
0.0/ 100
METRIC RATING
311th/ 347
METRIC RANK
97.6%
6TH GRADE
99.3/ 100
METRIC RATING
80th/ 347
METRIC RANK
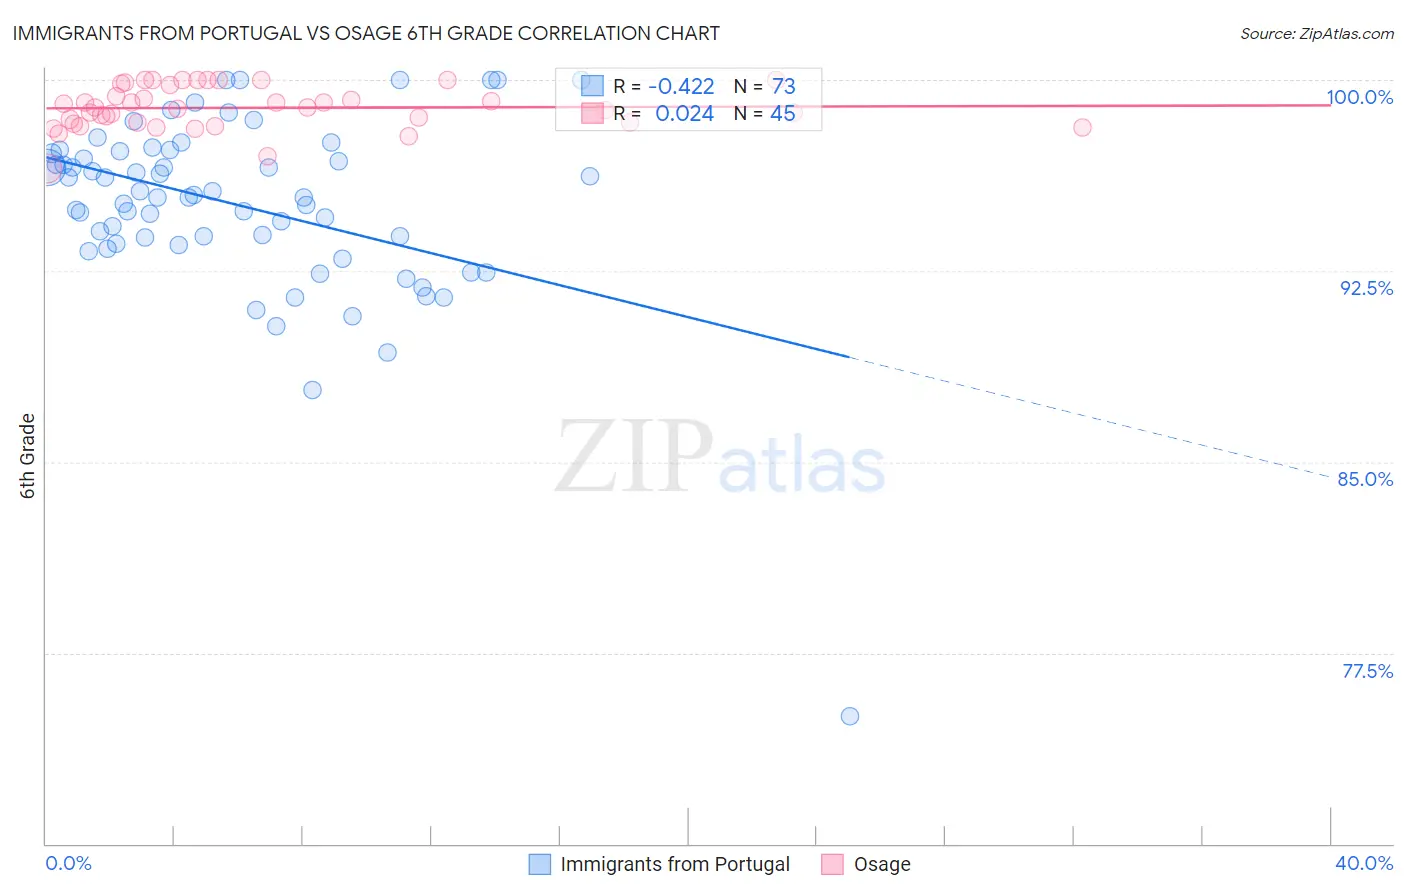
Immigrants from Portugal vs Osage 6th Grade Correlation Chart
The statistical analysis conducted on geographies consisting of 174,792,107 people shows a moderate negative correlation between the proportion of Immigrants from Portugal and percentage of population with at least 6th grade education in the United States with a correlation coefficient (R) of -0.422 and weighted average of 95.5%. Similarly, the statistical analysis conducted on geographies consisting of 91,808,929 people shows no correlation between the proportion of Osage and percentage of population with at least 6th grade education in the United States with a correlation coefficient (R) of 0.024 and weighted average of 97.6%, a difference of 2.2%.
6th Grade Correlation Summary
| Measurement | Immigrants from Portugal | Osage |
| Minimum | 75.0% | 96.5% |
| Maximum | 100.0% | 100.0% |
| Range | 25.0% | 3.5% |
| Mean | 95.1% | 98.9% |
| Median | 95.4% | 98.9% |
| Interquartile 25% (IQ1) | 93.5% | 98.3% |
| Interquartile 75% (IQ3) | 97.2% | 99.8% |
| Interquartile Range (IQR) | 3.6% | 1.5% |
| Standard Deviation (Sample) | 3.6% | 0.84% |
| Standard Deviation (Population) | 3.6% | 0.83% |
Similar Demographics by 6th Grade
Demographics Similar to Immigrants from Portugal by 6th Grade
In terms of 6th grade, the demographic groups most similar to Immigrants from Portugal are Immigrants from Guyana (95.5%, a difference of 0.010%), Ecuadorian (95.5%, a difference of 0.020%), Puerto Rican (95.5%, a difference of 0.030%), Immigrants from Caribbean (95.6%, a difference of 0.080%), and Guyanese (95.6%, a difference of 0.090%).
| Demographics | Rating | Rank | 6th Grade |
| Indonesians | 0.0 /100 | #304 | Tragic 95.6% |
| Immigrants | Cuba | 0.0 /100 | #305 | Tragic 95.6% |
| Immigrants | Haiti | 0.0 /100 | #306 | Tragic 95.6% |
| Guyanese | 0.0 /100 | #307 | Tragic 95.6% |
| Immigrants | Caribbean | 0.0 /100 | #308 | Tragic 95.6% |
| Puerto Ricans | 0.0 /100 | #309 | Tragic 95.5% |
| Ecuadorians | 0.0 /100 | #310 | Tragic 95.5% |
| Immigrants | Portugal | 0.0 /100 | #311 | Tragic 95.5% |
| Immigrants | Guyana | 0.0 /100 | #312 | Tragic 95.5% |
| Nicaraguans | 0.0 /100 | #313 | Tragic 95.4% |
| Immigrants | Vietnam | 0.0 /100 | #314 | Tragic 95.4% |
| Immigrants | Bangladesh | 0.0 /100 | #315 | Tragic 95.4% |
| Japanese | 0.0 /100 | #316 | Tragic 95.4% |
| Vietnamese | 0.0 /100 | #317 | Tragic 95.3% |
| Belizeans | 0.0 /100 | #318 | Tragic 95.3% |
Demographics Similar to Osage by 6th Grade
In terms of 6th grade, the demographic groups most similar to Osage are Immigrants from India (97.6%, a difference of 0.0%), Immigrants from Lithuania (97.6%, a difference of 0.010%), Icelander (97.6%, a difference of 0.010%), Lumbee (97.6%, a difference of 0.010%), and Immigrants from Netherlands (97.6%, a difference of 0.020%).
| Demographics | Rating | Rank | 6th Grade |
| Cherokee | 99.4 /100 | #73 | Exceptional 97.6% |
| Immigrants | Netherlands | 99.4 /100 | #74 | Exceptional 97.6% |
| Ukrainians | 99.4 /100 | #75 | Exceptional 97.6% |
| Immigrants | England | 99.4 /100 | #76 | Exceptional 97.6% |
| Immigrants | Lithuania | 99.3 /100 | #77 | Exceptional 97.6% |
| Icelanders | 99.3 /100 | #78 | Exceptional 97.6% |
| Immigrants | India | 99.3 /100 | #79 | Exceptional 97.6% |
| Osage | 99.3 /100 | #80 | Exceptional 97.6% |
| Lumbee | 99.2 /100 | #81 | Exceptional 97.6% |
| Zimbabweans | 99.1 /100 | #82 | Exceptional 97.6% |
| Potawatomi | 99.1 /100 | #83 | Exceptional 97.6% |
| Shoshone | 99.0 /100 | #84 | Exceptional 97.6% |
| Delaware | 98.9 /100 | #85 | Exceptional 97.6% |
| Immigrants | Belgium | 98.9 /100 | #86 | Exceptional 97.5% |
| Puget Sound Salish | 98.9 /100 | #87 | Exceptional 97.5% |