Immigrants from Portugal vs Cuban 2nd Grade
COMPARE
Immigrants from Portugal
Cuban
2nd Grade
2nd Grade Comparison
Immigrants from Portugal
Cubans
97.2%
2ND GRADE
0.0/ 100
METRIC RATING
287th/ 347
METRIC RANK
97.4%
2ND GRADE
0.3/ 100
METRIC RATING
267th/ 347
METRIC RANK
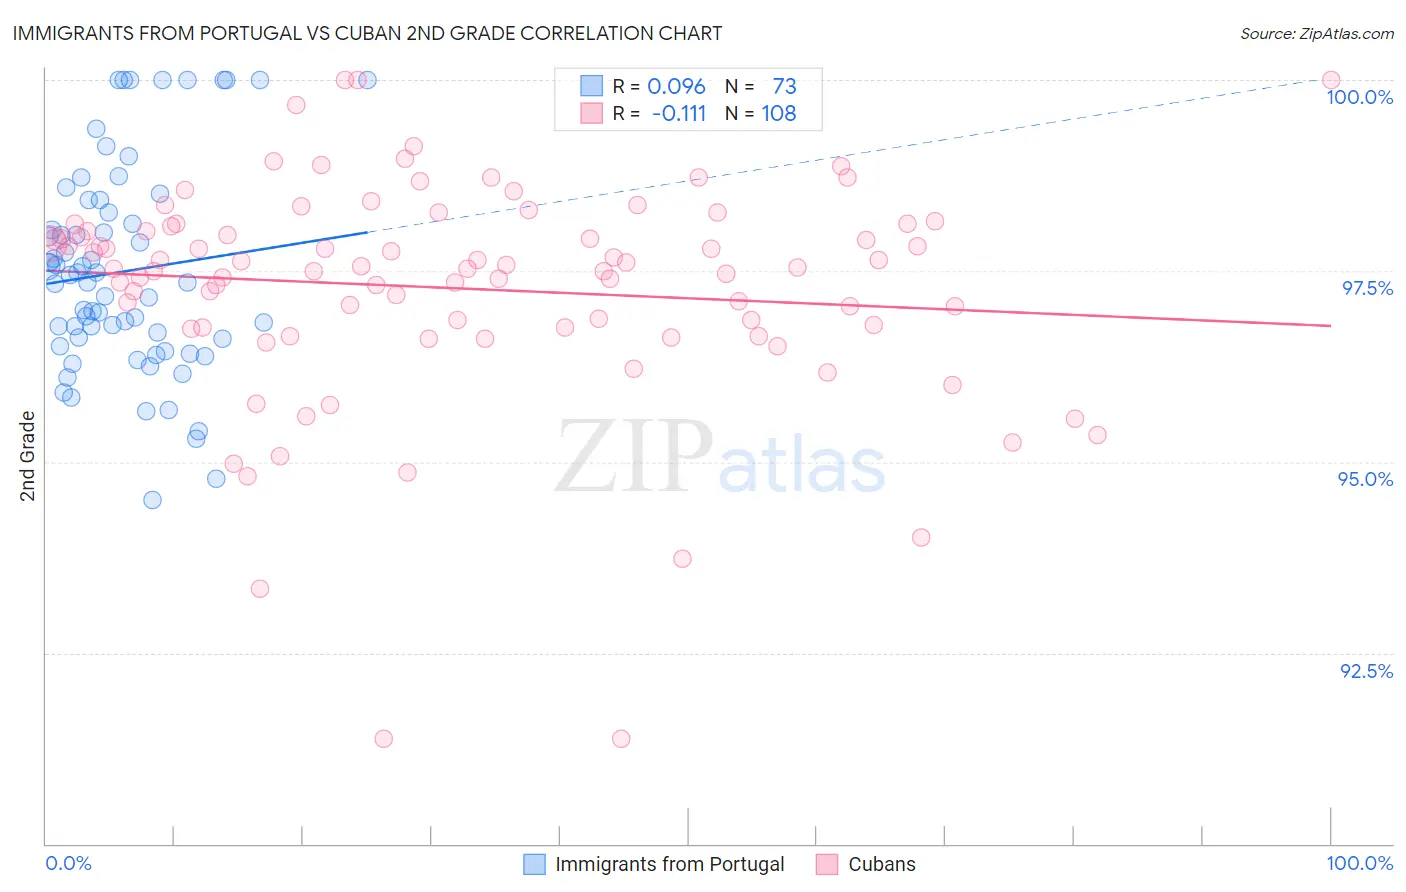
Immigrants from Portugal vs Cuban 2nd Grade Correlation Chart
The statistical analysis conducted on geographies consisting of 174,792,107 people shows a slight positive correlation between the proportion of Immigrants from Portugal and percentage of population with at least 2nd grade education in the United States with a correlation coefficient (R) of 0.096 and weighted average of 97.2%. Similarly, the statistical analysis conducted on geographies consisting of 449,326,865 people shows a poor negative correlation between the proportion of Cubans and percentage of population with at least 2nd grade education in the United States with a correlation coefficient (R) of -0.111 and weighted average of 97.4%, a difference of 0.20%.
2nd Grade Correlation Summary
| Measurement | Immigrants from Portugal | Cuban |
| Minimum | 94.5% | 91.4% |
| Maximum | 100.0% | 100.0% |
| Range | 5.5% | 8.6% |
| Mean | 97.5% | 97.3% |
| Median | 97.4% | 97.5% |
| Interquartile 25% (IQ1) | 96.6% | 96.8% |
| Interquartile 75% (IQ3) | 98.3% | 98.0% |
| Interquartile Range (IQR) | 1.8% | 1.3% |
| Standard Deviation (Sample) | 1.4% | 1.5% |
| Standard Deviation (Population) | 1.3% | 1.5% |
Demographics Similar to Immigrants from Portugal and Cubans by 2nd Grade
In terms of 2nd grade, the demographic groups most similar to Immigrants from Portugal are Immigrants from Hong Kong (97.2%, a difference of 0.0%), Immigrants from Barbados (97.2%, a difference of 0.0%), Immigrants from Trinidad and Tobago (97.2%, a difference of 0.020%), Immigrants from West Indies (97.2%, a difference of 0.020%), and Barbadian (97.3%, a difference of 0.060%). Similarly, the demographic groups most similar to Cubans are Immigrants from Nigeria (97.4%, a difference of 0.0%), West Indian (97.4%, a difference of 0.010%), Immigrants from Jamaica (97.4%, a difference of 0.020%), Immigrants from Cameroon (97.4%, a difference of 0.040%), and Immigrants from Peru (97.4%, a difference of 0.050%).
| Demographics | Rating | Rank | 2nd Grade |
| Cubans | 0.3 /100 | #267 | Tragic 97.4% |
| Immigrants | Nigeria | 0.3 /100 | #268 | Tragic 97.4% |
| West Indians | 0.3 /100 | #269 | Tragic 97.4% |
| Immigrants | Jamaica | 0.2 /100 | #270 | Tragic 97.4% |
| Immigrants | Cameroon | 0.2 /100 | #271 | Tragic 97.4% |
| Immigrants | Peru | 0.1 /100 | #272 | Tragic 97.4% |
| Immigrants | Bolivia | 0.1 /100 | #273 | Tragic 97.4% |
| Ghanaians | 0.1 /100 | #274 | Tragic 97.4% |
| Immigrants | China | 0.1 /100 | #275 | Tragic 97.3% |
| Immigrants | Philippines | 0.1 /100 | #276 | Tragic 97.3% |
| Immigrants | Western Africa | 0.1 /100 | #277 | Tragic 97.3% |
| Immigrants | Uzbekistan | 0.1 /100 | #278 | Tragic 97.3% |
| Immigrants | Ghana | 0.1 /100 | #279 | Tragic 97.3% |
| Afghans | 0.1 /100 | #280 | Tragic 97.3% |
| Trinidadians and Tobagonians | 0.1 /100 | #281 | Tragic 97.3% |
| Barbadians | 0.1 /100 | #282 | Tragic 97.3% |
| Immigrants | Trinidad and Tobago | 0.0 /100 | #283 | Tragic 97.2% |
| Immigrants | West Indies | 0.0 /100 | #284 | Tragic 97.2% |
| Immigrants | Hong Kong | 0.0 /100 | #285 | Tragic 97.2% |
| Immigrants | Barbados | 0.0 /100 | #286 | Tragic 97.2% |
| Immigrants | Portugal | 0.0 /100 | #287 | Tragic 97.2% |