Immigrants from Poland vs Potawatomi 10th Grade
COMPARE
Immigrants from Poland
Potawatomi
10th Grade
10th Grade Comparison
Immigrants from Poland
Potawatomi
93.9%
10TH GRADE
69.6/ 100
METRIC RATING
162nd/ 347
METRIC RANK
94.3%
10TH GRADE
93.6/ 100
METRIC RATING
128th/ 347
METRIC RANK
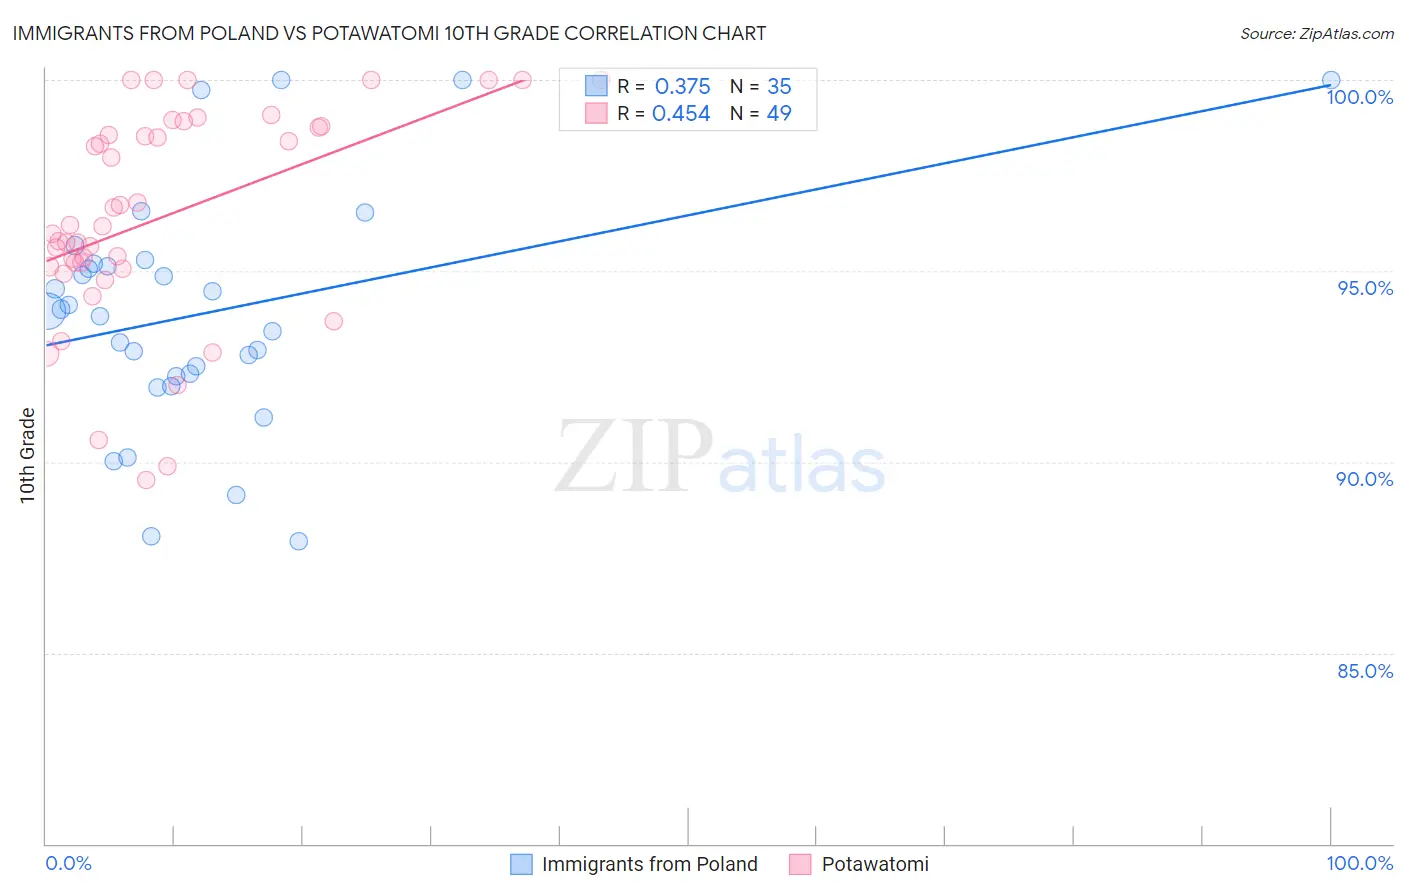
Immigrants from Poland vs Potawatomi 10th Grade Correlation Chart
The statistical analysis conducted on geographies consisting of 304,861,877 people shows a mild positive correlation between the proportion of Immigrants from Poland and percentage of population with at least 10th grade education in the United States with a correlation coefficient (R) of 0.375 and weighted average of 93.9%. Similarly, the statistical analysis conducted on geographies consisting of 117,769,158 people shows a moderate positive correlation between the proportion of Potawatomi and percentage of population with at least 10th grade education in the United States with a correlation coefficient (R) of 0.454 and weighted average of 94.3%, a difference of 0.42%.
10th Grade Correlation Summary
| Measurement | Immigrants from Poland | Potawatomi |
| Minimum | 87.9% | 89.5% |
| Maximum | 100.0% | 100.0% |
| Range | 12.1% | 10.5% |
| Mean | 93.9% | 96.4% |
| Median | 94.0% | 96.2% |
| Interquartile 25% (IQ1) | 92.3% | 95.1% |
| Interquartile 75% (IQ3) | 95.2% | 98.8% |
| Interquartile Range (IQR) | 2.9% | 3.7% |
| Standard Deviation (Sample) | 3.1% | 2.8% |
| Standard Deviation (Population) | 3.0% | 2.7% |
Similar Demographics by 10th Grade
Demographics Similar to Immigrants from Poland by 10th Grade
In terms of 10th grade, the demographic groups most similar to Immigrants from Poland are Assyrian/Chaldean/Syriac (93.9%, a difference of 0.0%), Venezuelan (93.9%, a difference of 0.0%), Chilean (93.9%, a difference of 0.010%), Pakistani (93.9%, a difference of 0.010%), and Bermudan (93.9%, a difference of 0.020%).
| Demographics | Rating | Rank | 10th Grade |
| Spanish | 74.9 /100 | #155 | Good 94.0% |
| Mongolians | 74.4 /100 | #156 | Good 94.0% |
| Kiowa | 73.3 /100 | #157 | Good 93.9% |
| Bermudans | 71.0 /100 | #158 | Good 93.9% |
| Chileans | 70.2 /100 | #159 | Good 93.9% |
| Pakistanis | 70.1 /100 | #160 | Good 93.9% |
| Assyrians/Chaldeans/Syriacs | 69.7 /100 | #161 | Good 93.9% |
| Immigrants | Poland | 69.6 /100 | #162 | Good 93.9% |
| Venezuelans | 69.5 /100 | #163 | Good 93.9% |
| Iraqis | 68.1 /100 | #164 | Good 93.9% |
| Brazilians | 63.6 /100 | #165 | Good 93.8% |
| Immigrants | Iraq | 63.0 /100 | #166 | Good 93.8% |
| Immigrants | Egypt | 62.3 /100 | #167 | Good 93.8% |
| Alsatians | 59.4 /100 | #168 | Average 93.8% |
| Immigrants | Spain | 55.9 /100 | #169 | Average 93.8% |
Demographics Similar to Potawatomi by 10th Grade
In terms of 10th grade, the demographic groups most similar to Potawatomi are Israeli (94.3%, a difference of 0.010%), American (94.3%, a difference of 0.030%), Immigrants from Iran (94.3%, a difference of 0.030%), Iroquois (94.3%, a difference of 0.030%), and Immigrants from Greece (94.3%, a difference of 0.030%).
| Demographics | Rating | Rank | 10th Grade |
| Immigrants | Belarus | 95.2 /100 | #121 | Exceptional 94.4% |
| Inupiat | 95.1 /100 | #122 | Exceptional 94.4% |
| Cree | 95.1 /100 | #123 | Exceptional 94.4% |
| Basques | 94.9 /100 | #124 | Exceptional 94.3% |
| Americans | 94.4 /100 | #125 | Exceptional 94.3% |
| Immigrants | Iran | 94.4 /100 | #126 | Exceptional 94.3% |
| Israelis | 93.8 /100 | #127 | Exceptional 94.3% |
| Potawatomi | 93.6 /100 | #128 | Exceptional 94.3% |
| Iroquois | 92.8 /100 | #129 | Exceptional 94.3% |
| Immigrants | Greece | 92.7 /100 | #130 | Exceptional 94.3% |
| Immigrants | Eastern Europe | 92.5 /100 | #131 | Exceptional 94.3% |
| Immigrants | Russia | 92.4 /100 | #132 | Exceptional 94.3% |
| Creek | 91.9 /100 | #133 | Exceptional 94.2% |
| Osage | 91.7 /100 | #134 | Exceptional 94.2% |
| Immigrants | Korea | 91.3 /100 | #135 | Exceptional 94.2% |