Immigrants from Poland vs Moroccan 2nd Grade
COMPARE
Immigrants from Poland
Moroccan
2nd Grade
2nd Grade Comparison
Immigrants from Poland
Moroccans
97.8%
2ND GRADE
42.2/ 100
METRIC RATING
183rd/ 347
METRIC RANK
97.7%
2ND GRADE
8.2/ 100
METRIC RATING
213th/ 347
METRIC RANK
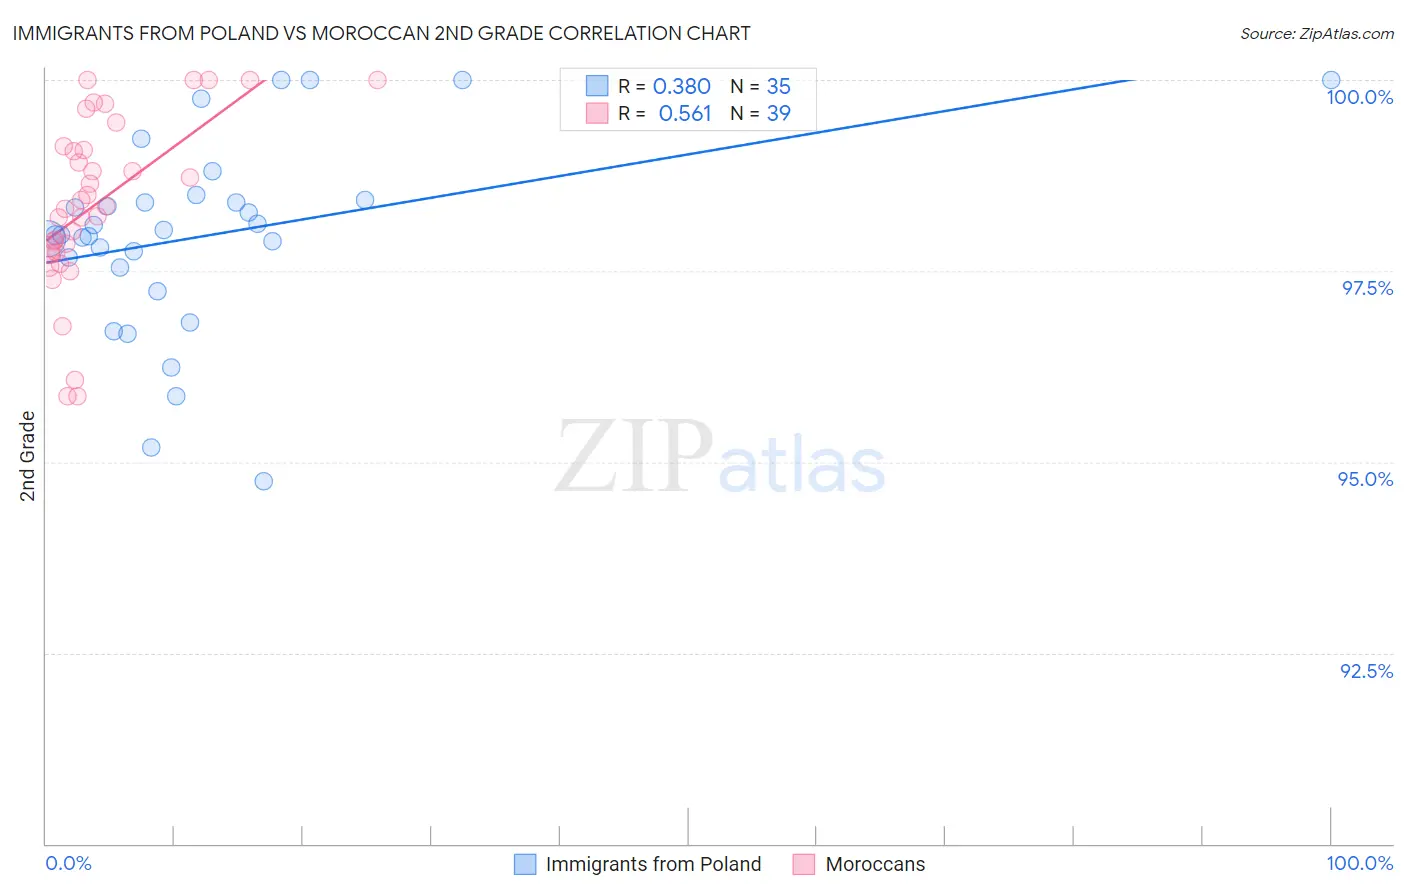
Immigrants from Poland vs Moroccan 2nd Grade Correlation Chart
The statistical analysis conducted on geographies consisting of 304,861,559 people shows a mild positive correlation between the proportion of Immigrants from Poland and percentage of population with at least 2nd grade education in the United States with a correlation coefficient (R) of 0.380 and weighted average of 97.8%. Similarly, the statistical analysis conducted on geographies consisting of 201,817,667 people shows a substantial positive correlation between the proportion of Moroccans and percentage of population with at least 2nd grade education in the United States with a correlation coefficient (R) of 0.561 and weighted average of 97.7%, a difference of 0.17%.
2nd Grade Correlation Summary
| Measurement | Immigrants from Poland | Moroccan |
| Minimum | 94.8% | 95.9% |
| Maximum | 100.0% | 100.0% |
| Range | 5.2% | 4.1% |
| Mean | 98.0% | 98.4% |
| Median | 98.0% | 98.3% |
| Interquartile 25% (IQ1) | 97.5% | 97.7% |
| Interquartile 75% (IQ3) | 98.4% | 99.1% |
| Interquartile Range (IQR) | 0.89% | 1.4% |
| Standard Deviation (Sample) | 1.3% | 1.1% |
| Standard Deviation (Population) | 1.2% | 1.1% |
Similar Demographics by 2nd Grade
Demographics Similar to Immigrants from Poland by 2nd Grade
In terms of 2nd grade, the demographic groups most similar to Immigrants from Poland are Portuguese (97.8%, a difference of 0.0%), Immigrants from Belarus (97.8%, a difference of 0.0%), Immigrants from Brazil (97.9%, a difference of 0.010%), Argentinean (97.9%, a difference of 0.010%), and Immigrants from Venezuela (97.9%, a difference of 0.010%).
| Demographics | Rating | Rank | 2nd Grade |
| Immigrants | Sri Lanka | 48.7 /100 | #176 | Average 97.9% |
| Immigrants | Brazil | 46.6 /100 | #177 | Average 97.9% |
| Argentineans | 46.3 /100 | #178 | Average 97.9% |
| Immigrants | Venezuela | 46.1 /100 | #179 | Average 97.9% |
| Natives/Alaskans | 44.3 /100 | #180 | Average 97.9% |
| Egyptians | 44.3 /100 | #181 | Average 97.9% |
| Portuguese | 42.4 /100 | #182 | Average 97.8% |
| Immigrants | Poland | 42.2 /100 | #183 | Average 97.8% |
| Immigrants | Belarus | 41.5 /100 | #184 | Average 97.8% |
| Immigrants | Argentina | 40.6 /100 | #185 | Average 97.8% |
| Arabs | 36.9 /100 | #186 | Fair 97.8% |
| Pakistanis | 36.1 /100 | #187 | Fair 97.8% |
| Immigrants | Kazakhstan | 35.6 /100 | #188 | Fair 97.8% |
| Panamanians | 33.5 /100 | #189 | Fair 97.8% |
| Immigrants | Taiwan | 31.8 /100 | #190 | Fair 97.8% |
Demographics Similar to Moroccans by 2nd Grade
In terms of 2nd grade, the demographic groups most similar to Moroccans are Immigrants from Bahamas (97.7%, a difference of 0.0%), Samoan (97.7%, a difference of 0.010%), Immigrants from Oceania (97.7%, a difference of 0.020%), Costa Rican (97.7%, a difference of 0.020%), and Laotian (97.7%, a difference of 0.020%).
| Demographics | Rating | Rank | 2nd Grade |
| Immigrants | Chile | 17.3 /100 | #206 | Poor 97.7% |
| Africans | 15.6 /100 | #207 | Poor 97.7% |
| Immigrants | Northern Africa | 12.3 /100 | #208 | Poor 97.7% |
| Immigrants | Oceania | 10.9 /100 | #209 | Poor 97.7% |
| Costa Ricans | 10.5 /100 | #210 | Poor 97.7% |
| Laotians | 9.9 /100 | #211 | Tragic 97.7% |
| Immigrants | Bahamas | 8.4 /100 | #212 | Tragic 97.7% |
| Moroccans | 8.2 /100 | #213 | Tragic 97.7% |
| Samoans | 7.1 /100 | #214 | Tragic 97.7% |
| Bahamians | 6.8 /100 | #215 | Tragic 97.7% |
| South American Indians | 6.7 /100 | #216 | Tragic 97.7% |
| Uruguayans | 6.2 /100 | #217 | Tragic 97.7% |
| Sudanese | 5.7 /100 | #218 | Tragic 97.7% |
| Immigrants | Panama | 5.1 /100 | #219 | Tragic 97.6% |
| Immigrants | Morocco | 5.0 /100 | #220 | Tragic 97.6% |