Immigrants from Poland vs Bulgarian Associate's Degree
COMPARE
Immigrants from Poland
Bulgarian
Associate's Degree
Associate's Degree Comparison
Immigrants from Poland
Bulgarians
47.1%
ASSOCIATE'S DEGREE
69.2/ 100
METRIC RATING
159th/ 347
METRIC RANK
53.3%
ASSOCIATE'S DEGREE
100.0/ 100
METRIC RATING
34th/ 347
METRIC RANK
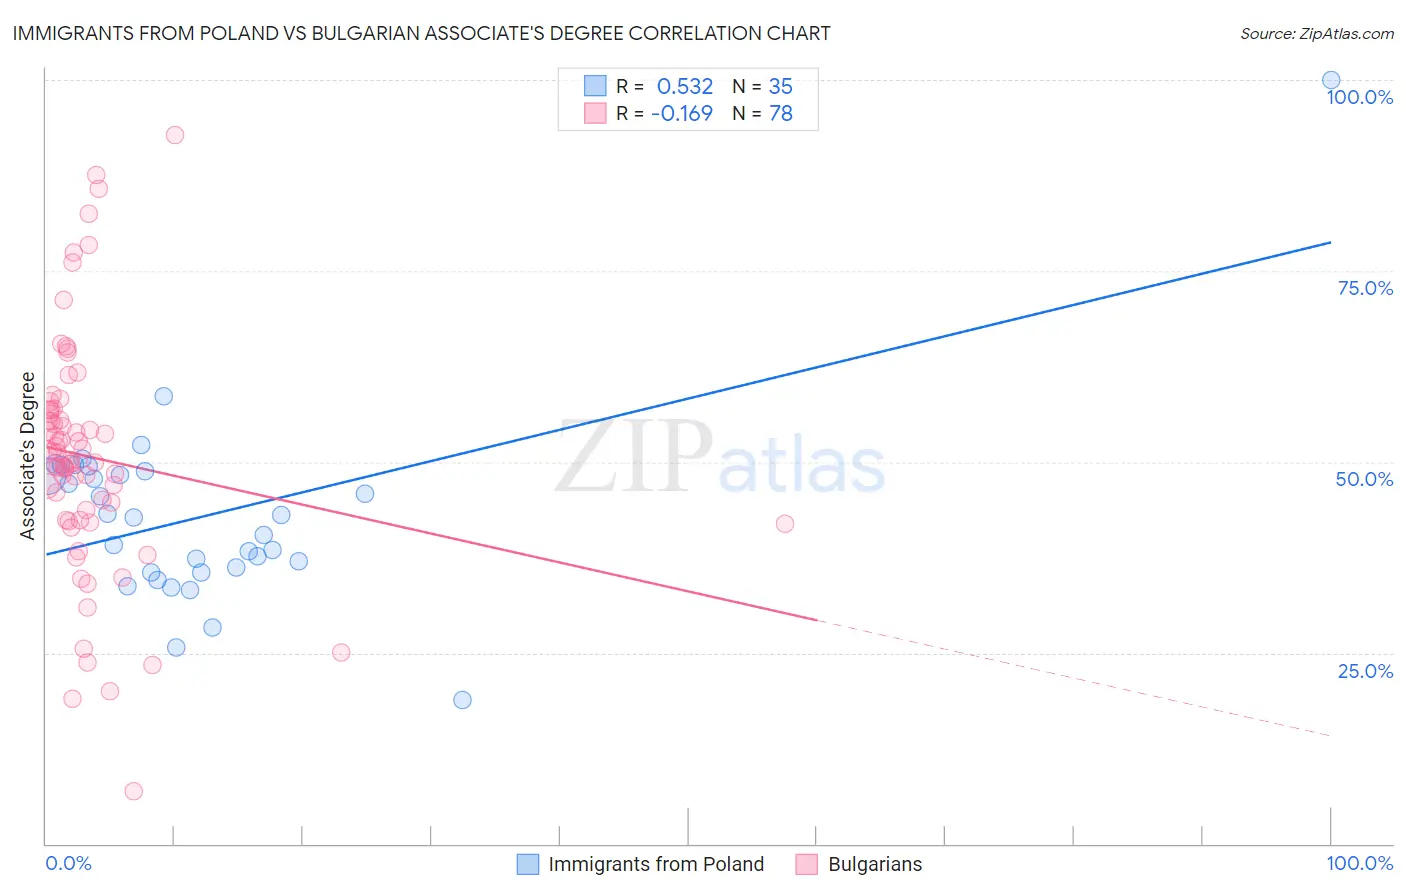
Immigrants from Poland vs Bulgarian Associate's Degree Correlation Chart
The statistical analysis conducted on geographies consisting of 304,854,598 people shows a substantial positive correlation between the proportion of Immigrants from Poland and percentage of population with at least associate's degree education in the United States with a correlation coefficient (R) of 0.532 and weighted average of 47.1%. Similarly, the statistical analysis conducted on geographies consisting of 205,619,803 people shows a poor negative correlation between the proportion of Bulgarians and percentage of population with at least associate's degree education in the United States with a correlation coefficient (R) of -0.169 and weighted average of 53.3%, a difference of 13.2%.
Associate's Degree Correlation Summary
| Measurement | Immigrants from Poland | Bulgarian |
| Minimum | 18.8% | 6.9% |
| Maximum | 100.0% | 92.7% |
| Range | 81.2% | 85.9% |
| Mean | 42.9% | 50.7% |
| Median | 42.8% | 50.7% |
| Interquartile 25% (IQ1) | 35.5% | 42.4% |
| Interquartile 75% (IQ3) | 48.8% | 56.8% |
| Interquartile Range (IQR) | 13.2% | 14.4% |
| Standard Deviation (Sample) | 13.0% | 15.5% |
| Standard Deviation (Population) | 12.8% | 15.4% |
Similar Demographics by Associate's Degree
Demographics Similar to Immigrants from Poland by Associate's Degree
In terms of associate's degree, the demographic groups most similar to Immigrants from Poland are Immigrants from Germany (47.1%, a difference of 0.050%), Sudanese (47.1%, a difference of 0.090%), South American (47.1%, a difference of 0.12%), Kenyan (47.1%, a difference of 0.13%), and Immigrants from Kenya (47.2%, a difference of 0.26%).
| Demographics | Rating | Rank | Associate's Degree |
| Immigrants | Afghanistan | 74.3 /100 | #152 | Good 47.3% |
| Czechs | 72.2 /100 | #153 | Good 47.2% |
| Immigrants | Kenya | 72.1 /100 | #154 | Good 47.2% |
| Kenyans | 70.6 /100 | #155 | Good 47.1% |
| South Americans | 70.5 /100 | #156 | Good 47.1% |
| Sudanese | 70.3 /100 | #157 | Good 47.1% |
| Immigrants | Germany | 69.7 /100 | #158 | Good 47.1% |
| Immigrants | Poland | 69.2 /100 | #159 | Good 47.1% |
| Scottish | 65.4 /100 | #160 | Good 46.9% |
| Scandinavians | 65.2 /100 | #161 | Good 46.9% |
| Immigrants | Africa | 63.2 /100 | #162 | Good 46.8% |
| Somalis | 62.5 /100 | #163 | Good 46.8% |
| Colombians | 62.4 /100 | #164 | Good 46.8% |
| Immigrants | South America | 59.9 /100 | #165 | Average 46.7% |
| Hungarians | 59.3 /100 | #166 | Average 46.7% |
Demographics Similar to Bulgarians by Associate's Degree
In terms of associate's degree, the demographic groups most similar to Bulgarians are Russian (53.2%, a difference of 0.060%), Israeli (53.4%, a difference of 0.19%), Immigrants from Turkey (53.4%, a difference of 0.31%), Immigrants from Northern Europe (53.5%, a difference of 0.34%), and Immigrants from Russia (53.1%, a difference of 0.35%).
| Demographics | Rating | Rank | Associate's Degree |
| Latvians | 100.0 /100 | #27 | Exceptional 53.9% |
| Turks | 100.0 /100 | #28 | Exceptional 53.9% |
| Immigrants | France | 100.0 /100 | #29 | Exceptional 53.9% |
| Immigrants | Sri Lanka | 100.0 /100 | #30 | Exceptional 53.7% |
| Immigrants | Northern Europe | 100.0 /100 | #31 | Exceptional 53.5% |
| Immigrants | Turkey | 100.0 /100 | #32 | Exceptional 53.4% |
| Israelis | 100.0 /100 | #33 | Exceptional 53.4% |
| Bulgarians | 100.0 /100 | #34 | Exceptional 53.3% |
| Russians | 100.0 /100 | #35 | Exceptional 53.2% |
| Immigrants | Russia | 100.0 /100 | #36 | Exceptional 53.1% |
| Immigrants | Denmark | 100.0 /100 | #37 | Exceptional 53.1% |
| Mongolians | 100.0 /100 | #38 | Exceptional 53.0% |
| Immigrants | Belarus | 99.9 /100 | #39 | Exceptional 52.8% |
| Immigrants | Latvia | 99.9 /100 | #40 | Exceptional 52.8% |
| Immigrants | Saudi Arabia | 99.9 /100 | #41 | Exceptional 52.6% |