Immigrants from Philippines vs Polish Master's Degree
COMPARE
Immigrants from Philippines
Polish
Master's Degree
Master's Degree Comparison
Immigrants from Philippines
Poles
13.6%
MASTER'S DEGREE
6.0/ 100
METRIC RATING
232nd/ 347
METRIC RANK
15.7%
MASTER'S DEGREE
85.0/ 100
METRIC RATING
141st/ 347
METRIC RANK
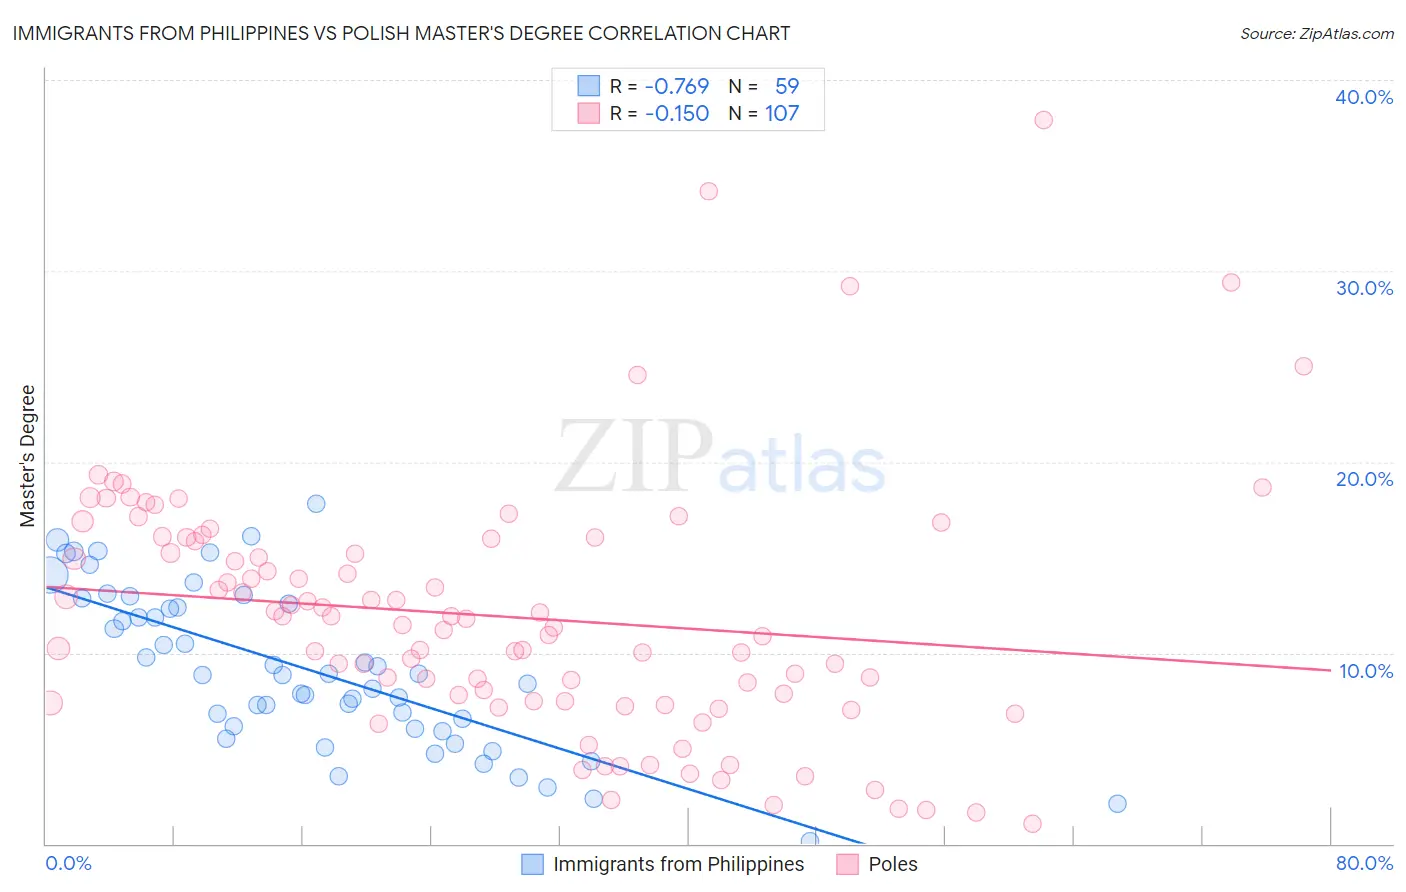
Immigrants from Philippines vs Polish Master's Degree Correlation Chart
The statistical analysis conducted on geographies consisting of 471,142,427 people shows a strong negative correlation between the proportion of Immigrants from Philippines and percentage of population with at least master's degree education in the United States with a correlation coefficient (R) of -0.769 and weighted average of 13.6%. Similarly, the statistical analysis conducted on geographies consisting of 559,882,025 people shows a poor negative correlation between the proportion of Poles and percentage of population with at least master's degree education in the United States with a correlation coefficient (R) of -0.150 and weighted average of 15.7%, a difference of 15.8%.
Master's Degree Correlation Summary
| Measurement | Immigrants from Philippines | Polish |
| Minimum | 0.15% | 1.0% |
| Maximum | 17.8% | 37.9% |
| Range | 17.6% | 36.9% |
| Mean | 9.1% | 11.9% |
| Median | 8.9% | 11.5% |
| Interquartile 25% (IQ1) | 6.1% | 7.4% |
| Interquartile 75% (IQ3) | 12.6% | 16.0% |
| Interquartile Range (IQR) | 6.5% | 8.5% |
| Standard Deviation (Sample) | 4.1% | 6.6% |
| Standard Deviation (Population) | 4.1% | 6.6% |
Similar Demographics by Master's Degree
Demographics Similar to Immigrants from Philippines by Master's Degree
In terms of master's degree, the demographic groups most similar to Immigrants from Philippines are Immigrants from Ecuador (13.6%, a difference of 0.15%), Immigrants from Burma/Myanmar (13.5%, a difference of 0.65%), Guyanese (13.7%, a difference of 0.88%), German Russian (13.5%, a difference of 1.1%), and Immigrants from Guyana (13.4%, a difference of 1.2%).
| Demographics | Rating | Rank | Master's Degree |
| Portuguese | 11.2 /100 | #225 | Poor 13.9% |
| Immigrants | St. Vincent and the Grenadines | 11.0 /100 | #226 | Poor 13.9% |
| Immigrants | West Indies | 9.8 /100 | #227 | Tragic 13.9% |
| Whites/Caucasians | 9.1 /100 | #228 | Tragic 13.8% |
| British West Indians | 8.8 /100 | #229 | Tragic 13.8% |
| Dutch | 8.7 /100 | #230 | Tragic 13.8% |
| Guyanese | 7.6 /100 | #231 | Tragic 13.7% |
| Immigrants | Philippines | 6.0 /100 | #232 | Tragic 13.6% |
| Immigrants | Ecuador | 5.7 /100 | #233 | Tragic 13.6% |
| Immigrants | Burma/Myanmar | 5.0 /100 | #234 | Tragic 13.5% |
| German Russians | 4.5 /100 | #235 | Tragic 13.5% |
| Immigrants | Guyana | 4.4 /100 | #236 | Tragic 13.4% |
| Jamaicans | 4.1 /100 | #237 | Tragic 13.4% |
| Hmong | 4.0 /100 | #238 | Tragic 13.4% |
| Immigrants | Nonimmigrants | 3.4 /100 | #239 | Tragic 13.3% |
Demographics Similar to Poles by Master's Degree
In terms of master's degree, the demographic groups most similar to Poles are Vietnamese (15.8%, a difference of 0.12%), Immigrants from Germany (15.8%, a difference of 0.21%), Immigrants from Africa (15.7%, a difference of 0.23%), Pakistani (15.8%, a difference of 0.27%), and Immigrants from Venezuela (15.7%, a difference of 0.32%).
| Demographics | Rating | Rank | Master's Degree |
| Venezuelans | 88.4 /100 | #134 | Excellent 15.9% |
| South American Indians | 88.4 /100 | #135 | Excellent 15.9% |
| Assyrians/Chaldeans/Syriacs | 86.8 /100 | #136 | Excellent 15.8% |
| Europeans | 86.4 /100 | #137 | Excellent 15.8% |
| Pakistanis | 86.1 /100 | #138 | Excellent 15.8% |
| Immigrants | Germany | 85.9 /100 | #139 | Excellent 15.8% |
| Vietnamese | 85.5 /100 | #140 | Excellent 15.8% |
| Poles | 85.0 /100 | #141 | Excellent 15.7% |
| Immigrants | Africa | 84.0 /100 | #142 | Excellent 15.7% |
| Immigrants | Venezuela | 83.6 /100 | #143 | Excellent 15.7% |
| Canadians | 83.3 /100 | #144 | Excellent 15.7% |
| South Americans | 81.3 /100 | #145 | Excellent 15.6% |
| Immigrants | Afghanistan | 79.4 /100 | #146 | Good 15.6% |
| Hungarians | 79.1 /100 | #147 | Good 15.6% |
| Immigrants | Senegal | 78.2 /100 | #148 | Good 15.5% |