Immigrants from Philippines vs Navajo Nursery School
COMPARE
Immigrants from Philippines
Navajo
Nursery School
Nursery School Comparison
Immigrants from Philippines
Navajo
97.5%
NURSERY SCHOOL
0.1/ 100
METRIC RATING
276th/ 347
METRIC RANK
98.0%
NURSERY SCHOOL
50.0/ 100
METRIC RATING
174th/ 347
METRIC RANK
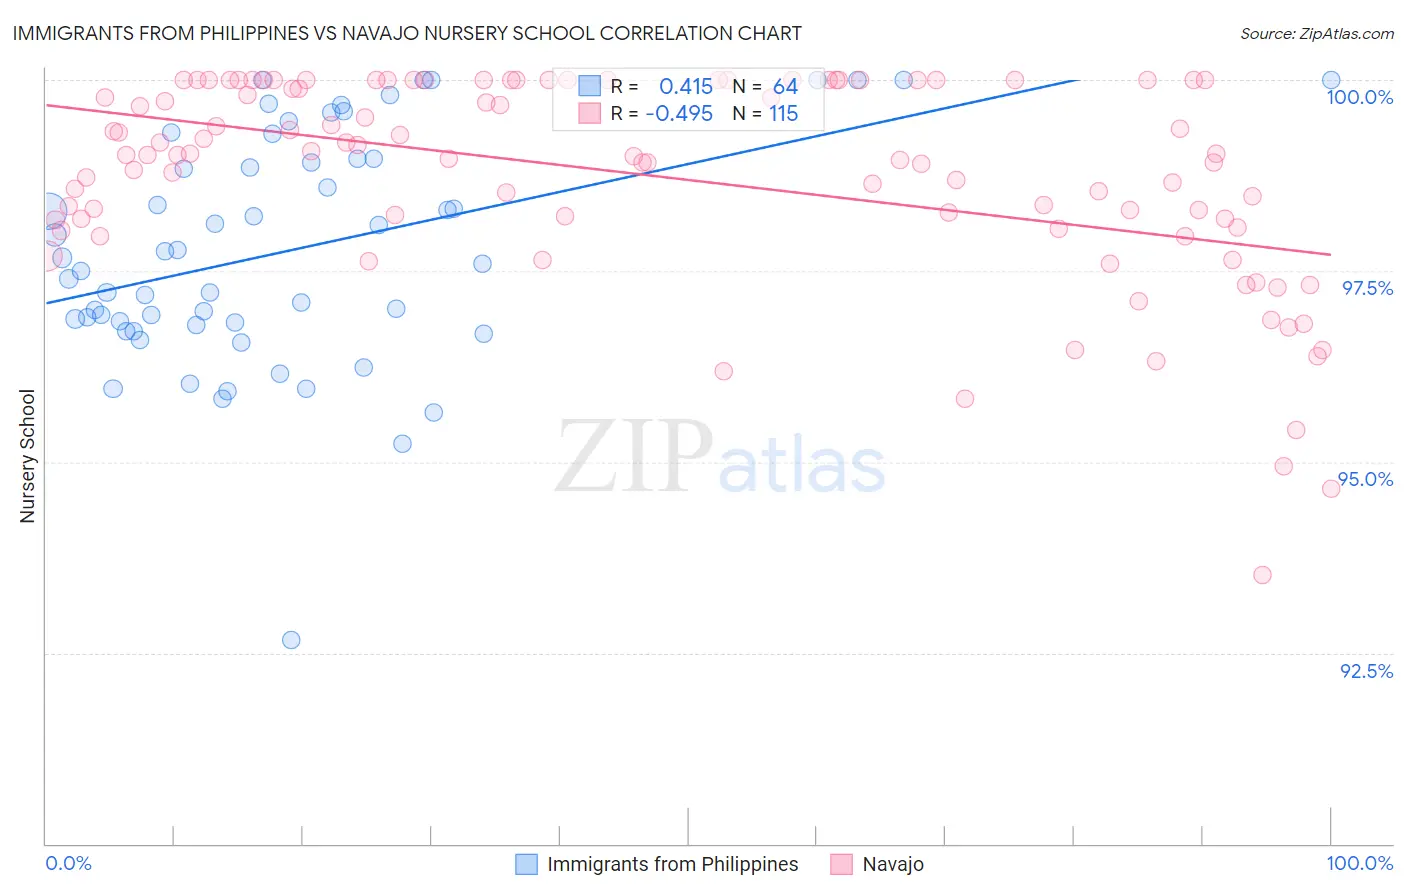
Immigrants from Philippines vs Navajo Nursery School Correlation Chart
The statistical analysis conducted on geographies consisting of 471,303,140 people shows a moderate positive correlation between the proportion of Immigrants from Philippines and percentage of population with at least nursery school education in the United States with a correlation coefficient (R) of 0.415 and weighted average of 97.5%. Similarly, the statistical analysis conducted on geographies consisting of 224,872,493 people shows a moderate negative correlation between the proportion of Navajo and percentage of population with at least nursery school education in the United States with a correlation coefficient (R) of -0.495 and weighted average of 98.0%, a difference of 0.54%.
Nursery School Correlation Summary
| Measurement | Immigrants from Philippines | Navajo |
| Minimum | 92.7% | 93.5% |
| Maximum | 100.0% | 100.0% |
| Range | 7.3% | 6.5% |
| Mean | 97.8% | 98.7% |
| Median | 97.6% | 99.0% |
| Interquartile 25% (IQ1) | 96.8% | 98.2% |
| Interquartile 75% (IQ3) | 99.0% | 100.0% |
| Interquartile Range (IQR) | 2.2% | 1.8% |
| Standard Deviation (Sample) | 1.5% | 1.3% |
| Standard Deviation (Population) | 1.5% | 1.3% |
Similar Demographics by Nursery School
Demographics Similar to Immigrants from Philippines by Nursery School
In terms of nursery school, the demographic groups most similar to Immigrants from Philippines are Immigrants from Western Africa (97.4%, a difference of 0.010%), Immigrants from China (97.5%, a difference of 0.020%), Immigrants from Cameroon (97.5%, a difference of 0.020%), Ghanaian (97.5%, a difference of 0.020%), and Immigrants from Uzbekistan (97.4%, a difference of 0.030%).
| Demographics | Rating | Rank | Nursery School |
| Immigrants | Liberia | 0.3 /100 | #269 | Tragic 97.5% |
| Immigrants | Jamaica | 0.2 /100 | #270 | Tragic 97.5% |
| Immigrants | Peru | 0.2 /100 | #271 | Tragic 97.5% |
| Immigrants | Bolivia | 0.1 /100 | #272 | Tragic 97.5% |
| Immigrants | China | 0.1 /100 | #273 | Tragic 97.5% |
| Immigrants | Cameroon | 0.1 /100 | #274 | Tragic 97.5% |
| Ghanaians | 0.1 /100 | #275 | Tragic 97.5% |
| Immigrants | Philippines | 0.1 /100 | #276 | Tragic 97.5% |
| Immigrants | Western Africa | 0.1 /100 | #277 | Tragic 97.4% |
| Immigrants | Uzbekistan | 0.1 /100 | #278 | Tragic 97.4% |
| Immigrants | Ghana | 0.1 /100 | #279 | Tragic 97.4% |
| Barbadians | 0.0 /100 | #280 | Tragic 97.4% |
| Trinidadians and Tobagonians | 0.0 /100 | #281 | Tragic 97.4% |
| Afghans | 0.0 /100 | #282 | Tragic 97.4% |
| Immigrants | West Indies | 0.0 /100 | #283 | Tragic 97.4% |
Demographics Similar to Navajo by Nursery School
In terms of nursery school, the demographic groups most similar to Navajo are Immigrants from Brazil (98.0%, a difference of 0.0%), Kenyan (98.0%, a difference of 0.0%), Immigrants from Sri Lanka (98.0%, a difference of 0.0%), Immigrants from Venezuela (98.0%, a difference of 0.0%), and Albanian (98.0%, a difference of 0.0%).
| Demographics | Rating | Rank | Nursery School |
| Immigrants | Spain | 55.6 /100 | #167 | Average 98.0% |
| Immigrants | Micronesia | 55.0 /100 | #168 | Average 98.0% |
| Immigrants | Korea | 53.8 /100 | #169 | Average 98.0% |
| Bermudans | 53.7 /100 | #170 | Average 98.0% |
| Immigrants | Jordan | 53.4 /100 | #171 | Average 98.0% |
| Immigrants | Brazil | 51.3 /100 | #172 | Average 98.0% |
| Kenyans | 50.2 /100 | #173 | Average 98.0% |
| Navajo | 50.0 /100 | #174 | Average 98.0% |
| Immigrants | Sri Lanka | 49.9 /100 | #175 | Average 98.0% |
| Immigrants | Venezuela | 49.8 /100 | #176 | Average 98.0% |
| Albanians | 48.9 /100 | #177 | Average 98.0% |
| Natives/Alaskans | 48.6 /100 | #178 | Average 98.0% |
| Argentineans | 46.8 /100 | #179 | Average 98.0% |
| Immigrants | Bosnia and Herzegovina | 45.6 /100 | #180 | Average 98.0% |
| Egyptians | 42.8 /100 | #181 | Average 98.0% |