Immigrants from Peru vs Lithuanian 6th Grade
COMPARE
Immigrants from Peru
Lithuanian
6th Grade
6th Grade Comparison
Immigrants from Peru
Lithuanians
96.2%
6TH GRADE
0.1/ 100
METRIC RATING
279th/ 347
METRIC RANK
98.1%
6TH GRADE
100.0/ 100
METRIC RATING
21st/ 347
METRIC RANK
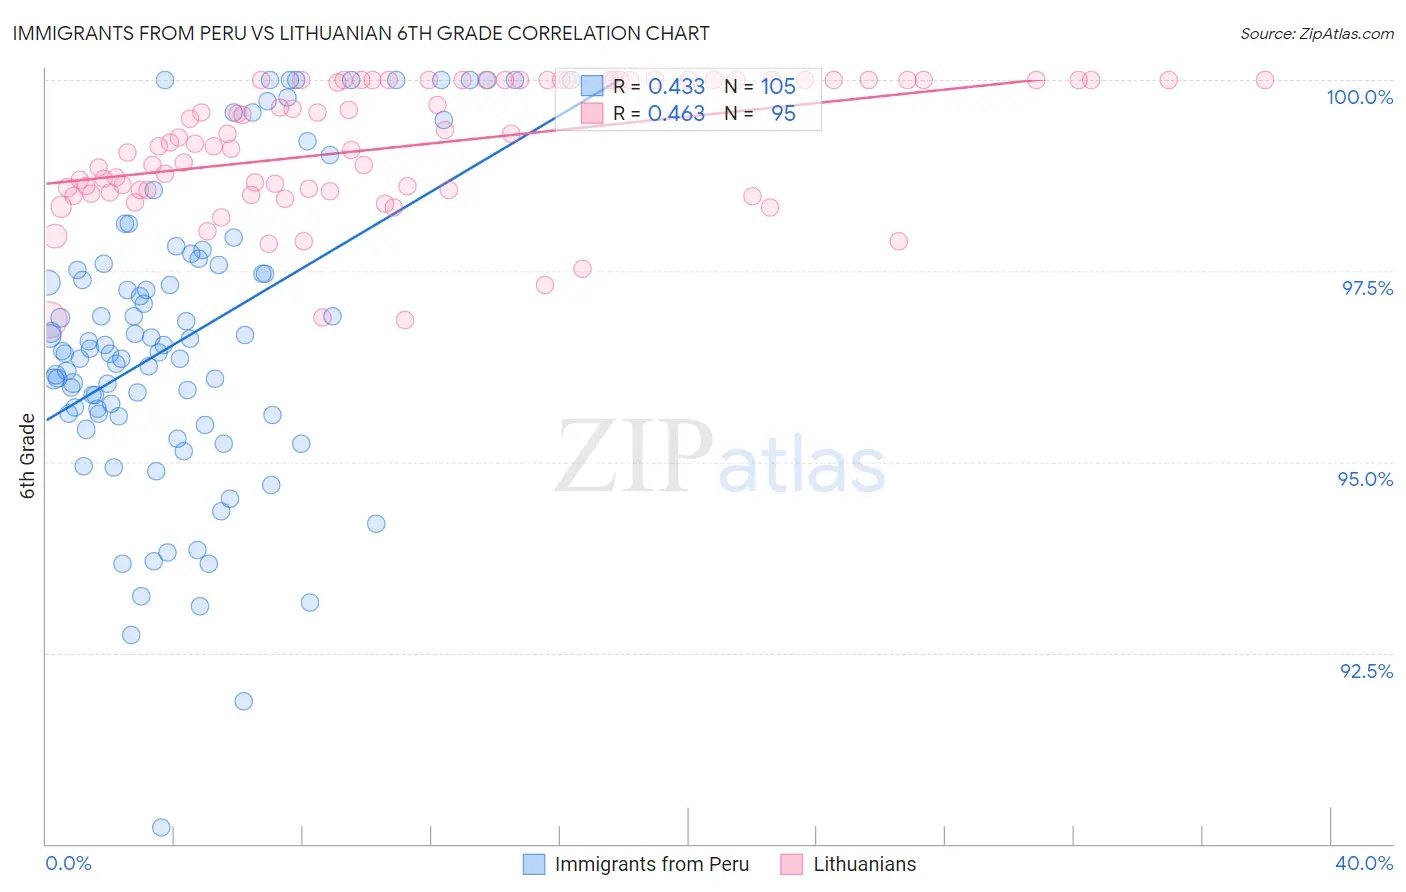
Immigrants from Peru vs Lithuanian 6th Grade Correlation Chart
The statistical analysis conducted on geographies consisting of 328,685,754 people shows a moderate positive correlation between the proportion of Immigrants from Peru and percentage of population with at least 6th grade education in the United States with a correlation coefficient (R) of 0.433 and weighted average of 96.2%. Similarly, the statistical analysis conducted on geographies consisting of 421,945,620 people shows a moderate positive correlation between the proportion of Lithuanians and percentage of population with at least 6th grade education in the United States with a correlation coefficient (R) of 0.463 and weighted average of 98.1%, a difference of 1.9%.
6th Grade Correlation Summary
| Measurement | Immigrants from Peru | Lithuanian |
| Minimum | 90.2% | 96.9% |
| Maximum | 100.0% | 100.0% |
| Range | 9.8% | 3.1% |
| Mean | 96.6% | 99.1% |
| Median | 96.5% | 99.2% |
| Interquartile 25% (IQ1) | 95.6% | 98.6% |
| Interquartile 75% (IQ3) | 97.6% | 100.0% |
| Interquartile Range (IQR) | 2.0% | 1.4% |
| Standard Deviation (Sample) | 2.0% | 0.84% |
| Standard Deviation (Population) | 2.0% | 0.84% |
Similar Demographics by 6th Grade
Demographics Similar to Immigrants from Peru by 6th Grade
In terms of 6th grade, the demographic groups most similar to Immigrants from Peru are Immigrants from Afghanistan (96.2%, a difference of 0.0%), Trinidadian and Tobagonian (96.2%, a difference of 0.0%), Houma (96.2%, a difference of 0.0%), Immigrants from Thailand (96.3%, a difference of 0.010%), and Yaqui (96.3%, a difference of 0.020%).
| Demographics | Rating | Rank | 6th Grade |
| Immigrants | Bolivia | 0.1 /100 | #272 | Tragic 96.3% |
| Immigrants | Cameroon | 0.1 /100 | #273 | Tragic 96.3% |
| Immigrants | Philippines | 0.1 /100 | #274 | Tragic 96.3% |
| Immigrants | Ghana | 0.1 /100 | #275 | Tragic 96.3% |
| Yaqui | 0.1 /100 | #276 | Tragic 96.3% |
| Immigrants | Western Africa | 0.1 /100 | #277 | Tragic 96.3% |
| Immigrants | Thailand | 0.1 /100 | #278 | Tragic 96.3% |
| Immigrants | Peru | 0.1 /100 | #279 | Tragic 96.2% |
| Immigrants | Afghanistan | 0.1 /100 | #280 | Tragic 96.2% |
| Trinidadians and Tobagonians | 0.1 /100 | #281 | Tragic 96.2% |
| Houma | 0.1 /100 | #282 | Tragic 96.2% |
| Cubans | 0.1 /100 | #283 | Tragic 96.2% |
| Fijians | 0.1 /100 | #284 | Tragic 96.2% |
| Somalis | 0.1 /100 | #285 | Tragic 96.2% |
| Barbadians | 0.0 /100 | #286 | Tragic 96.2% |
Demographics Similar to Lithuanians by 6th Grade
In terms of 6th grade, the demographic groups most similar to Lithuanians are Finnish (98.1%, a difference of 0.010%), Danish (98.0%, a difference of 0.020%), Polish (98.1%, a difference of 0.030%), Pennsylvania German (98.1%, a difference of 0.030%), and Irish (98.1%, a difference of 0.030%).
| Demographics | Rating | Rank | 6th Grade |
| Carpatho Rusyns | 100.0 /100 | #14 | Exceptional 98.1% |
| Inupiat | 100.0 /100 | #15 | Exceptional 98.1% |
| Scottish | 100.0 /100 | #16 | Exceptional 98.1% |
| Poles | 100.0 /100 | #17 | Exceptional 98.1% |
| Pennsylvania Germans | 100.0 /100 | #18 | Exceptional 98.1% |
| Irish | 100.0 /100 | #19 | Exceptional 98.1% |
| Finns | 100.0 /100 | #20 | Exceptional 98.1% |
| Lithuanians | 100.0 /100 | #21 | Exceptional 98.1% |
| Danes | 100.0 /100 | #22 | Exceptional 98.0% |
| Sioux | 100.0 /100 | #23 | Exceptional 98.0% |
| Croatians | 100.0 /100 | #24 | Exceptional 98.0% |
| Scotch-Irish | 100.0 /100 | #25 | Exceptional 98.0% |
| Czechs | 100.0 /100 | #26 | Exceptional 98.0% |
| Yup'ik | 100.0 /100 | #27 | Exceptional 98.0% |
| Scandinavians | 100.0 /100 | #28 | Exceptional 98.0% |