Immigrants from Peru vs Eastern European Associate's Degree
COMPARE
Immigrants from Peru
Eastern European
Associate's Degree
Associate's Degree Comparison
Immigrants from Peru
Eastern Europeans
45.5%
ASSOCIATE'S DEGREE
27.6/ 100
METRIC RATING
194th/ 347
METRIC RANK
55.0%
ASSOCIATE'S DEGREE
100.0/ 100
METRIC RATING
17th/ 347
METRIC RANK
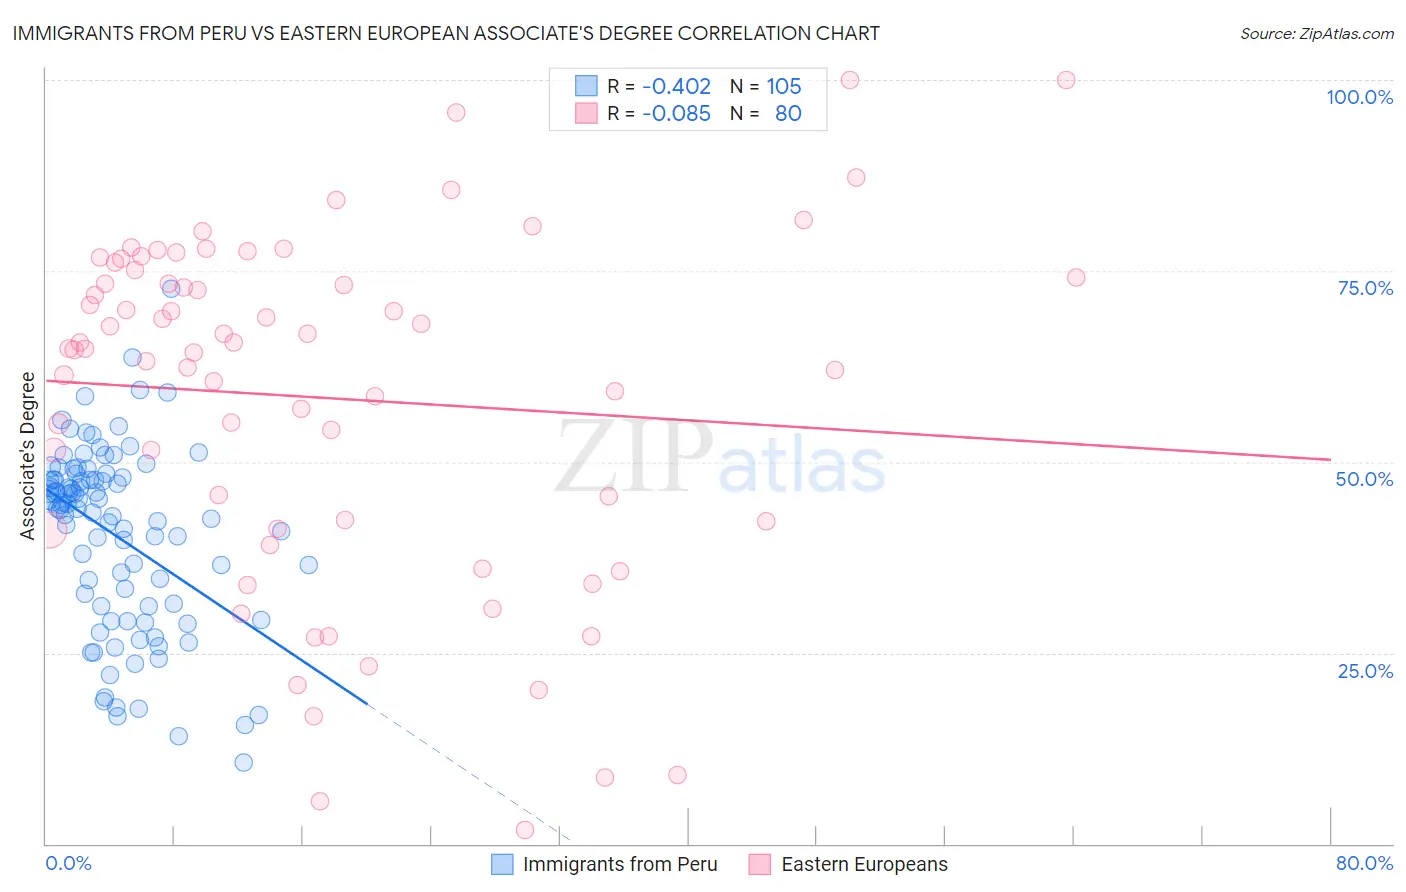
Immigrants from Peru vs Eastern European Associate's Degree Correlation Chart
The statistical analysis conducted on geographies consisting of 328,856,641 people shows a moderate negative correlation between the proportion of Immigrants from Peru and percentage of population with at least associate's degree education in the United States with a correlation coefficient (R) of -0.402 and weighted average of 45.5%. Similarly, the statistical analysis conducted on geographies consisting of 461,211,672 people shows a slight negative correlation between the proportion of Eastern Europeans and percentage of population with at least associate's degree education in the United States with a correlation coefficient (R) of -0.085 and weighted average of 55.0%, a difference of 20.9%.
Associate's Degree Correlation Summary
| Measurement | Immigrants from Peru | Eastern European |
| Minimum | 10.6% | 1.8% |
| Maximum | 72.7% | 100.0% |
| Range | 62.1% | 98.2% |
| Mean | 40.4% | 58.3% |
| Median | 43.8% | 64.8% |
| Interquartile 25% (IQ1) | 31.2% | 41.8% |
| Interquartile 75% (IQ3) | 47.8% | 74.6% |
| Interquartile Range (IQR) | 16.6% | 32.9% |
| Standard Deviation (Sample) | 12.0% | 22.7% |
| Standard Deviation (Population) | 11.9% | 22.6% |
Similar Demographics by Associate's Degree
Demographics Similar to Immigrants from Peru by Associate's Degree
In terms of associate's degree, the demographic groups most similar to Immigrants from Peru are German (45.5%, a difference of 0.10%), French (45.4%, a difference of 0.19%), Immigrants from Cameroon (45.7%, a difference of 0.32%), Celtic (45.8%, a difference of 0.51%), and Scotch-Irish (45.3%, a difference of 0.54%).
| Demographics | Rating | Rank | Associate's Degree |
| Immigrants | Uruguay | 35.5 /100 | #187 | Fair 45.8% |
| Ghanaians | 35.5 /100 | #188 | Fair 45.8% |
| Immigrants | Oceania | 34.7 /100 | #189 | Fair 45.8% |
| Vietnamese | 34.0 /100 | #190 | Fair 45.8% |
| Koreans | 33.8 /100 | #191 | Fair 45.8% |
| Celtics | 33.3 /100 | #192 | Fair 45.8% |
| Immigrants | Cameroon | 31.0 /100 | #193 | Fair 45.7% |
| Immigrants | Peru | 27.6 /100 | #194 | Fair 45.5% |
| Germans | 26.5 /100 | #195 | Fair 45.5% |
| French | 25.6 /100 | #196 | Fair 45.4% |
| Scotch-Irish | 22.3 /100 | #197 | Fair 45.3% |
| Immigrants | Bangladesh | 21.3 /100 | #198 | Fair 45.2% |
| Immigrants | Senegal | 21.2 /100 | #199 | Fair 45.2% |
| Senegalese | 21.1 /100 | #200 | Fair 45.2% |
| Immigrants | Vietnam | 20.8 /100 | #201 | Fair 45.2% |
Demographics Similar to Eastern Europeans by Associate's Degree
In terms of associate's degree, the demographic groups most similar to Eastern Europeans are Soviet Union (55.1%, a difference of 0.14%), Indian (Asian) (54.8%, a difference of 0.48%), Immigrants from Eastern Asia (55.4%, a difference of 0.61%), Immigrants from Hong Kong (55.4%, a difference of 0.64%), and Immigrants from Ireland (54.7%, a difference of 0.70%).
| Demographics | Rating | Rank | Associate's Degree |
| Cypriots | 100.0 /100 | #10 | Exceptional 56.4% |
| Immigrants | Australia | 100.0 /100 | #11 | Exceptional 55.8% |
| Immigrants | South Central Asia | 100.0 /100 | #12 | Exceptional 55.7% |
| Immigrants | China | 100.0 /100 | #13 | Exceptional 55.5% |
| Immigrants | Hong Kong | 100.0 /100 | #14 | Exceptional 55.4% |
| Immigrants | Eastern Asia | 100.0 /100 | #15 | Exceptional 55.4% |
| Soviet Union | 100.0 /100 | #16 | Exceptional 55.1% |
| Eastern Europeans | 100.0 /100 | #17 | Exceptional 55.0% |
| Indians (Asian) | 100.0 /100 | #18 | Exceptional 54.8% |
| Immigrants | Ireland | 100.0 /100 | #19 | Exceptional 54.7% |
| Cambodians | 100.0 /100 | #20 | Exceptional 54.6% |
| Immigrants | Sweden | 100.0 /100 | #21 | Exceptional 54.6% |
| Immigrants | Japan | 100.0 /100 | #22 | Exceptional 54.6% |
| Burmese | 100.0 /100 | #23 | Exceptional 54.6% |
| Immigrants | Korea | 100.0 /100 | #24 | Exceptional 54.5% |