Immigrants from Pakistan vs Laotian 6th Grade
COMPARE
Immigrants from Pakistan
Laotian
6th Grade
6th Grade Comparison
Immigrants from Pakistan
Laotians
96.7%
6TH GRADE
4.4/ 100
METRIC RATING
225th/ 347
METRIC RANK
96.8%
6TH GRADE
11.8/ 100
METRIC RATING
206th/ 347
METRIC RANK
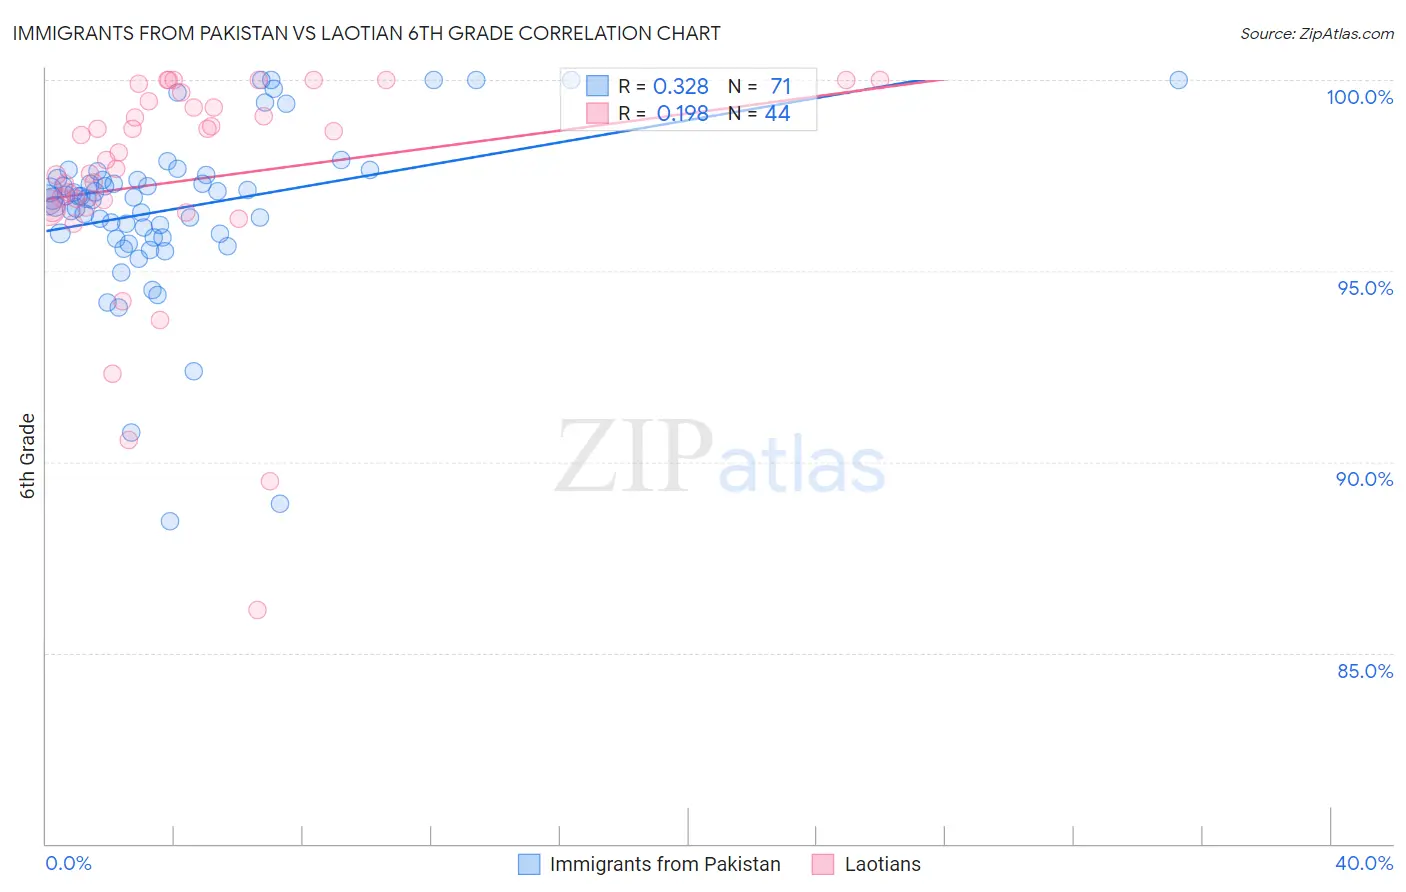
Immigrants from Pakistan vs Laotian 6th Grade Correlation Chart
The statistical analysis conducted on geographies consisting of 283,900,935 people shows a mild positive correlation between the proportion of Immigrants from Pakistan and percentage of population with at least 6th grade education in the United States with a correlation coefficient (R) of 0.328 and weighted average of 96.7%. Similarly, the statistical analysis conducted on geographies consisting of 224,856,650 people shows a poor positive correlation between the proportion of Laotians and percentage of population with at least 6th grade education in the United States with a correlation coefficient (R) of 0.198 and weighted average of 96.8%, a difference of 0.12%.
6th Grade Correlation Summary
| Measurement | Immigrants from Pakistan | Laotian |
| Minimum | 88.4% | 86.1% |
| Maximum | 100.0% | 100.0% |
| Range | 11.6% | 13.9% |
| Mean | 96.6% | 97.4% |
| Median | 96.9% | 98.0% |
| Interquartile 25% (IQ1) | 95.9% | 96.6% |
| Interquartile 75% (IQ3) | 97.4% | 99.4% |
| Interquartile Range (IQR) | 1.5% | 2.7% |
| Standard Deviation (Sample) | 2.2% | 3.0% |
| Standard Deviation (Population) | 2.2% | 3.0% |
Demographics Similar to Immigrants from Pakistan and Laotians by 6th Grade
In terms of 6th grade, the demographic groups most similar to Immigrants from Pakistan are Immigrants from Southern Europe (96.7%, a difference of 0.0%), Bahamian (96.7%, a difference of 0.010%), Immigrants from Syria (96.7%, a difference of 0.030%), Immigrants from Morocco (96.7%, a difference of 0.040%), and Tongan (96.7%, a difference of 0.040%). Similarly, the demographic groups most similar to Laotians are Iraqi (96.8%, a difference of 0.0%), Native/Alaskan (96.8%, a difference of 0.010%), Samoan (96.8%, a difference of 0.010%), Immigrants from Oceania (96.8%, a difference of 0.010%), and Immigrants from Nepal (96.8%, a difference of 0.020%).
| Demographics | Rating | Rank | 6th Grade |
| Natives/Alaskans | 13.0 /100 | #205 | Poor 96.8% |
| Laotians | 11.8 /100 | #206 | Poor 96.8% |
| Iraqis | 11.7 /100 | #207 | Poor 96.8% |
| Samoans | 11.0 /100 | #208 | Poor 96.8% |
| Immigrants | Oceania | 11.0 /100 | #209 | Poor 96.8% |
| Immigrants | Nepal | 10.1 /100 | #210 | Poor 96.8% |
| Immigrants | Iraq | 9.2 /100 | #211 | Tragic 96.8% |
| Moroccans | 9.0 /100 | #212 | Tragic 96.8% |
| Immigrants | Sudan | 8.7 /100 | #213 | Tragic 96.8% |
| Portuguese | 8.2 /100 | #214 | Tragic 96.8% |
| Sierra Leoneans | 8.0 /100 | #215 | Tragic 96.8% |
| Paiute | 7.8 /100 | #216 | Tragic 96.8% |
| Liberians | 7.5 /100 | #217 | Tragic 96.8% |
| Navajo | 7.3 /100 | #218 | Tragic 96.8% |
| Costa Ricans | 6.8 /100 | #219 | Tragic 96.8% |
| Immigrants | Morocco | 6.2 /100 | #220 | Tragic 96.7% |
| Tongans | 6.1 /100 | #221 | Tragic 96.7% |
| Immigrants | Syria | 5.9 /100 | #222 | Tragic 96.7% |
| Bahamians | 4.8 /100 | #223 | Tragic 96.7% |
| Immigrants | Southern Europe | 4.4 /100 | #224 | Tragic 96.7% |
| Immigrants | Pakistan | 4.4 /100 | #225 | Tragic 96.7% |