Immigrants from Oceania vs Macedonian 11th Grade
COMPARE
Immigrants from Oceania
Macedonian
11th Grade
11th Grade Comparison
Immigrants from Oceania
Macedonians
92.2%
11TH GRADE
22.4/ 100
METRIC RATING
207th/ 347
METRIC RANK
94.1%
11TH GRADE
99.9/ 100
METRIC RATING
48th/ 347
METRIC RANK
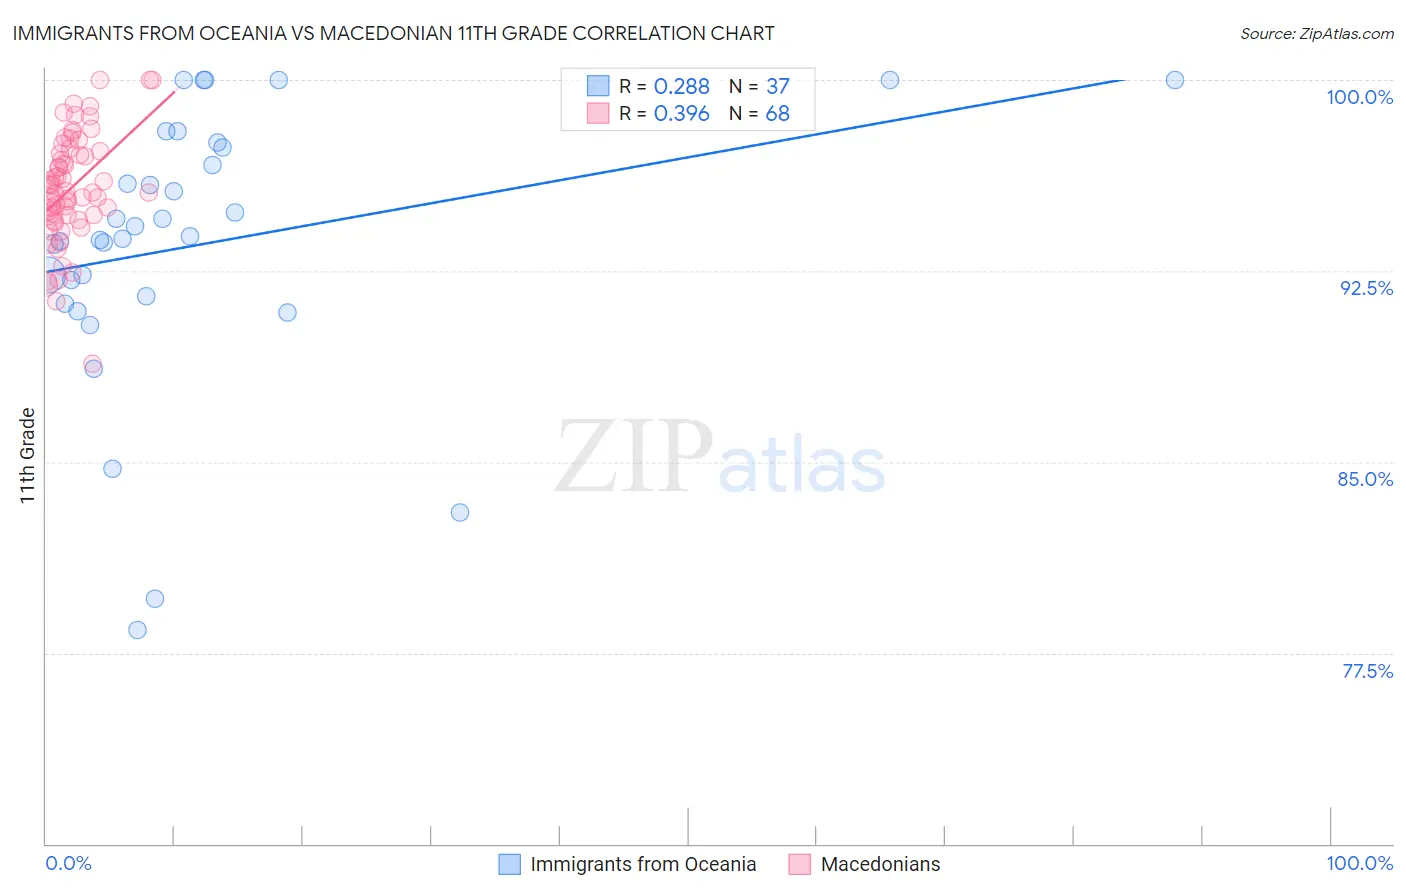
Immigrants from Oceania vs Macedonian 11th Grade Correlation Chart
The statistical analysis conducted on geographies consisting of 305,521,521 people shows a weak positive correlation between the proportion of Immigrants from Oceania and percentage of population with at least 11th grade education in the United States with a correlation coefficient (R) of 0.288 and weighted average of 92.2%. Similarly, the statistical analysis conducted on geographies consisting of 132,646,607 people shows a mild positive correlation between the proportion of Macedonians and percentage of population with at least 11th grade education in the United States with a correlation coefficient (R) of 0.396 and weighted average of 94.1%, a difference of 2.0%.
11th Grade Correlation Summary
| Measurement | Immigrants from Oceania | Macedonian |
| Minimum | 78.4% | 88.9% |
| Maximum | 100.0% | 100.0% |
| Range | 21.6% | 11.1% |
| Mean | 93.6% | 95.8% |
| Median | 93.8% | 95.6% |
| Interquartile 25% (IQ1) | 91.4% | 94.7% |
| Interquartile 75% (IQ3) | 97.5% | 97.1% |
| Interquartile Range (IQR) | 6.1% | 2.5% |
| Standard Deviation (Sample) | 5.3% | 2.2% |
| Standard Deviation (Population) | 5.3% | 2.1% |
Similar Demographics by 11th Grade
Demographics Similar to Immigrants from Oceania by 11th Grade
In terms of 11th grade, the demographic groups most similar to Immigrants from Oceania are Immigrants from Sudan (92.3%, a difference of 0.010%), Immigrants from Hong Kong (92.2%, a difference of 0.010%), Kiowa (92.2%, a difference of 0.010%), Bolivian (92.2%, a difference of 0.010%), and Colville (92.2%, a difference of 0.010%).
| Demographics | Rating | Rank | 11th Grade |
| Samoans | 25.1 /100 | #200 | Fair 92.3% |
| Immigrants | China | 25.1 /100 | #201 | Fair 92.3% |
| Immigrants | Eastern Africa | 24.1 /100 | #202 | Fair 92.3% |
| Immigrants | Sudan | 23.5 /100 | #203 | Fair 92.3% |
| Immigrants | Hong Kong | 23.3 /100 | #204 | Fair 92.2% |
| Kiowa | 23.2 /100 | #205 | Fair 92.2% |
| Bolivians | 23.2 /100 | #206 | Fair 92.2% |
| Immigrants | Oceania | 22.4 /100 | #207 | Fair 92.2% |
| Colville | 21.8 /100 | #208 | Fair 92.2% |
| Tongans | 19.8 /100 | #209 | Poor 92.2% |
| Ethiopians | 18.8 /100 | #210 | Poor 92.2% |
| Immigrants | Micronesia | 17.7 /100 | #211 | Poor 92.2% |
| Koreans | 14.4 /100 | #212 | Poor 92.1% |
| Immigrants | Ethiopia | 13.9 /100 | #213 | Poor 92.1% |
| Afghans | 12.8 /100 | #214 | Poor 92.1% |
Demographics Similar to Macedonians by 11th Grade
In terms of 11th grade, the demographic groups most similar to Macedonians are Filipino (94.1%, a difference of 0.0%), Slavic (94.1%, a difference of 0.0%), French (94.1%, a difference of 0.0%), Serbian (94.1%, a difference of 0.010%), and Australian (94.1%, a difference of 0.020%).
| Demographics | Rating | Rank | 11th Grade |
| Cypriots | 99.9 /100 | #41 | Exceptional 94.1% |
| Immigrants | Austria | 99.9 /100 | #42 | Exceptional 94.1% |
| Greeks | 99.9 /100 | #43 | Exceptional 94.1% |
| Immigrants | Ireland | 99.9 /100 | #44 | Exceptional 94.1% |
| Australians | 99.9 /100 | #45 | Exceptional 94.1% |
| Serbians | 99.9 /100 | #46 | Exceptional 94.1% |
| Filipinos | 99.9 /100 | #47 | Exceptional 94.1% |
| Macedonians | 99.9 /100 | #48 | Exceptional 94.1% |
| Slavs | 99.9 /100 | #49 | Exceptional 94.1% |
| French | 99.9 /100 | #50 | Exceptional 94.1% |
| Turks | 99.9 /100 | #51 | Exceptional 94.0% |
| Immigrants | Canada | 99.9 /100 | #52 | Exceptional 94.0% |
| Immigrants | Australia | 99.9 /100 | #53 | Exceptional 94.0% |
| Immigrants | North America | 99.9 /100 | #54 | Exceptional 94.0% |
| Czechoslovakians | 99.9 /100 | #55 | Exceptional 94.0% |