Immigrants from Norway vs Okinawan Associate's Degree

COMPARE

Immigrants from Norway
Race
Ancestry
AfghanAfricanAlaska NativeAlaskan AthabascanAlbanianAleutAlsatianAmericanApacheArabArapahoArgentineanArmenianAssyrian/Chaldean/SyriacAustralianAustrianBahamianBangladeshiBarbadianBasqueBelgianBelizeanBermudanBhutaneseBlackfeetBolivianBrazilianBritishBritish West IndianBulgarianBurmeseCajunCambodianCanadianCape VerdeanCarpatho RusynCelticCentral AmericanCentral American IndianCherokeeCheyenneChickasawChileanChineseChippewaChoctawColombianColvilleComancheCosta RicanCreeCreekCroatianCrowCubanCypriotCzechCzechoslovakianDanishDelawareDominicanDutchDutch West IndianEastern EuropeanEcuadorianEgyptianEnglishEstonianEthiopianEuropeanFijianFilipinoFinnishFrenchFrench American IndianFrench CanadianGermanGerman RussianGhanaianGreekGuamanian/ChamorroGuatemalanGuyaneseHaitianHmongHonduranHopiHoumaHungarianIcelanderIndian (Asian)IndonesianInupiatIranianIraqiIrishIroquoisIsraeliItalianJamaicanJapaneseJordanianKenyanKiowaKoreanLaotianLatvianLebaneseLiberianLithuanianLumbeeLuxembourgerMacedonianMalaysianMalteseMarshalleseMenomineeMexicanMexican American IndianMongolianMoroccanNative HawaiianNavajoNepaleseNew ZealanderNicaraguanNigerianNorthern EuropeanNorwegianOsageOttawaPaiutePakistaniPalestinianPanamanianParaguayanPennsylvania GermanPeruvianPimaPolishPortuguesePotawatomiPuebloPuerto RicanPuget Sound SalishRomanianRussianSalvadoranSamoanScandinavianScotch-IrishScottishSeminoleSenegaleseSerbianShoshoneSierra LeoneanSiouxSlavicSlovakSloveneSomaliSouth AfricanSouth AmericanSouth American IndianSoviet UnionSpaniardSpanishSpanish AmericanSpanish American IndianSri LankanSubsaharan AfricanSudaneseSwedishSwissSyrianTaiwaneseThaiTlingit-HaidaTohono O'OdhamTonganTrinidadian and TobagonianTsimshianTurkishU.S. Virgin IslanderUgandanUkrainianUruguayanUteVenezuelanVietnameseWelshWest IndianYakamaYaquiYugoslavianYumanYup'ikZimbabwean
Immigration
NonimmigrantsImmigrantsAfghanistanAfricaAlbaniaArgentinaArmeniaAsiaAustraliaAustriaBahamasBangladeshBarbadosBelarusBelgiumBelizeBoliviaBosnia and HerzegovinaBrazilBulgariaBurma/MyanmarCabo VerdeCambodiaCameroonCanadaCaribbeanCentral AmericaChileChinaColombiaCongoCosta RicaCroatiaCubaCzechoslovakiaDenmarkDominicaDominican RepublicEastern AfricaEastern AsiaEastern EuropeEcuadorEgyptEl SalvadorEnglandEritreaEthiopiaEuropeFijiFranceGermanyGhanaGreeceGrenadaGuatemalaGuyanaHaitiHondurasHong KongHungaryIndiaIndonesiaIranIraqIrelandIsraelItalyJamaicaJapanJordanKazakhstanKenyaKoreaKuwaitLaosLatin AmericaLatviaLebanonLiberiaLithuaniaMalaysiaMexicoMicronesiaMiddle AfricaMoldovaMoroccoNepalNetherlandsNicaraguaNigeriaNorth AmericaNorth MacedoniaNorthern AfricaNorthern EuropeNorwayOceaniaPakistanPanamaPeruPhilippinesPolandPortugalRomaniaRussiaSaudi ArabiaScotlandSenegalSerbiaSierra LeoneSingaporeSomaliaSouth AfricaSouth AmericaSouth Central AsiaSouth Eastern AsiaSouthern EuropeSpainSri LankaSt. Vincent and the GrenadinesSudanSwedenSwitzerlandSyriaTaiwanThailandTrinidad and TobagoTurkeyUgandaUkraineUruguayUzbekistanVenezuelaVietnamWest IndiesWestern AfricaWestern AsiaWestern EuropeYemenZaireZimbabweAzores
Okinawan
Race
Ancestry
AfghanAfricanAlaska NativeAlaskan AthabascanAlbanianAleutAlsatianAmericanApacheArabArapahoArgentineanArmenianAssyrian/Chaldean/SyriacAustralianAustrianBahamianBangladeshiBarbadianBasqueBelgianBelizeanBermudanBhutaneseBlackfeetBolivianBrazilianBritishBritish West IndianBulgarianBurmeseCajunCambodianCanadianCape VerdeanCarpatho RusynCelticCentral AmericanCentral American IndianCherokeeCheyenneChickasawChileanChineseChippewaChoctawColombianColvilleComancheCosta RicanCreeCreekCroatianCrowCubanCypriotCzechCzechoslovakianDanishDelawareDominicanDutchDutch West IndianEastern EuropeanEcuadorianEgyptianEnglishEstonianEthiopianEuropeanFijianFilipinoFinnishFrenchFrench American IndianFrench CanadianGermanGerman RussianGhanaianGreekGuamanian/ChamorroGuatemalanGuyaneseHaitianHmongHonduranHopiHoumaHungarianIcelanderIndian (Asian)IndonesianInupiatIranianIraqiIrishIroquoisIsraeliItalianJamaicanJapaneseJordanianKenyanKiowaKoreanLaotianLatvianLebaneseLiberianLithuanianLumbeeLuxembourgerMacedonianMalaysianMalteseMarshalleseMenomineeMexicanMexican American IndianMongolianMoroccanNative HawaiianNavajoNepaleseNew ZealanderNicaraguanNigerianNorthern EuropeanNorwegianOkinawanOsageOttawaPaiutePakistaniPalestinianPanamanianParaguayanPennsylvania GermanPeruvianPimaPolishPortuguesePotawatomiPuebloPuerto RicanPuget Sound SalishRomanianRussianSalvadoranSamoanScandinavianScotch-IrishScottishSeminoleSenegaleseSerbianShoshoneSierra LeoneanSiouxSlavicSlovakSloveneSomaliSouth AfricanSouth AmericanSouth American IndianSoviet UnionSpaniardSpanishSpanish AmericanSpanish American IndianSri LankanSubsaharan AfricanSudaneseSwedishSwissSyrianTaiwaneseThaiTlingit-HaidaTohono O'OdhamTonganTrinidadian and TobagonianTsimshianTurkishU.S. Virgin IslanderUgandanUkrainianUruguayanUteVenezuelanVietnameseWelshWest IndianYakamaYaquiYugoslavianYumanYup'ikZimbabwean
Immigration
NonimmigrantsImmigrantsAfghanistanAfricaAlbaniaArgentinaArmeniaAsiaAustraliaAustriaBahamasBangladeshBarbadosBelarusBelgiumBelizeBoliviaBosnia and HerzegovinaBrazilBulgariaBurma/MyanmarCabo VerdeCambodiaCameroonCanadaCaribbeanCentral AmericaChileChinaColombiaCongoCosta RicaCroatiaCubaCzechoslovakiaDenmarkDominicaDominican RepublicEastern AfricaEastern AsiaEastern EuropeEcuadorEgyptEl SalvadorEnglandEritreaEthiopiaEuropeFijiFranceGermanyGhanaGreeceGrenadaGuatemalaGuyanaHaitiHondurasHong KongHungaryIndiaIndonesiaIranIraqIrelandIsraelItalyJamaicaJapanJordanKazakhstanKenyaKoreaKuwaitLaosLatin AmericaLatviaLebanonLiberiaLithuaniaMalaysiaMexicoMicronesiaMiddle AfricaMoldovaMoroccoNepalNetherlandsNicaraguaNigeriaNorth AmericaNorth MacedoniaNorthern AfricaNorthern EuropeOceaniaPakistanPanamaPeruPhilippinesPolandPortugalRomaniaRussiaSaudi ArabiaScotlandSenegalSerbiaSierra LeoneSingaporeSomaliaSouth AfricaSouth AmericaSouth Central AsiaSouth Eastern AsiaSouthern EuropeSpainSri LankaSt. Vincent and the GrenadinesSudanSwedenSwitzerlandSyriaTaiwanThailandTrinidad and TobagoTurkeyUgandaUkraineUruguayUzbekistanVenezuelaVietnamWest IndiesWestern AfricaWestern AsiaWestern EuropeYemenZaireZimbabweAzores
Associate's Degree
Income
Poverty
Unemployment
Labor Participation
Family Structure
Vehicle Availability
Education Level
Disability

Associate's Degree Comparison

Immigrants from Norway

Okinawans

Exceptional
Exceptional
52.2%
ASSOCIATE'S DEGREE
99.9/ 100
METRIC RATING
48th/ 347
METRIC RANK
57.7%
ASSOCIATE'S DEGREE
100.0/ 100
METRIC RATING
6th/ 347
METRIC RANK

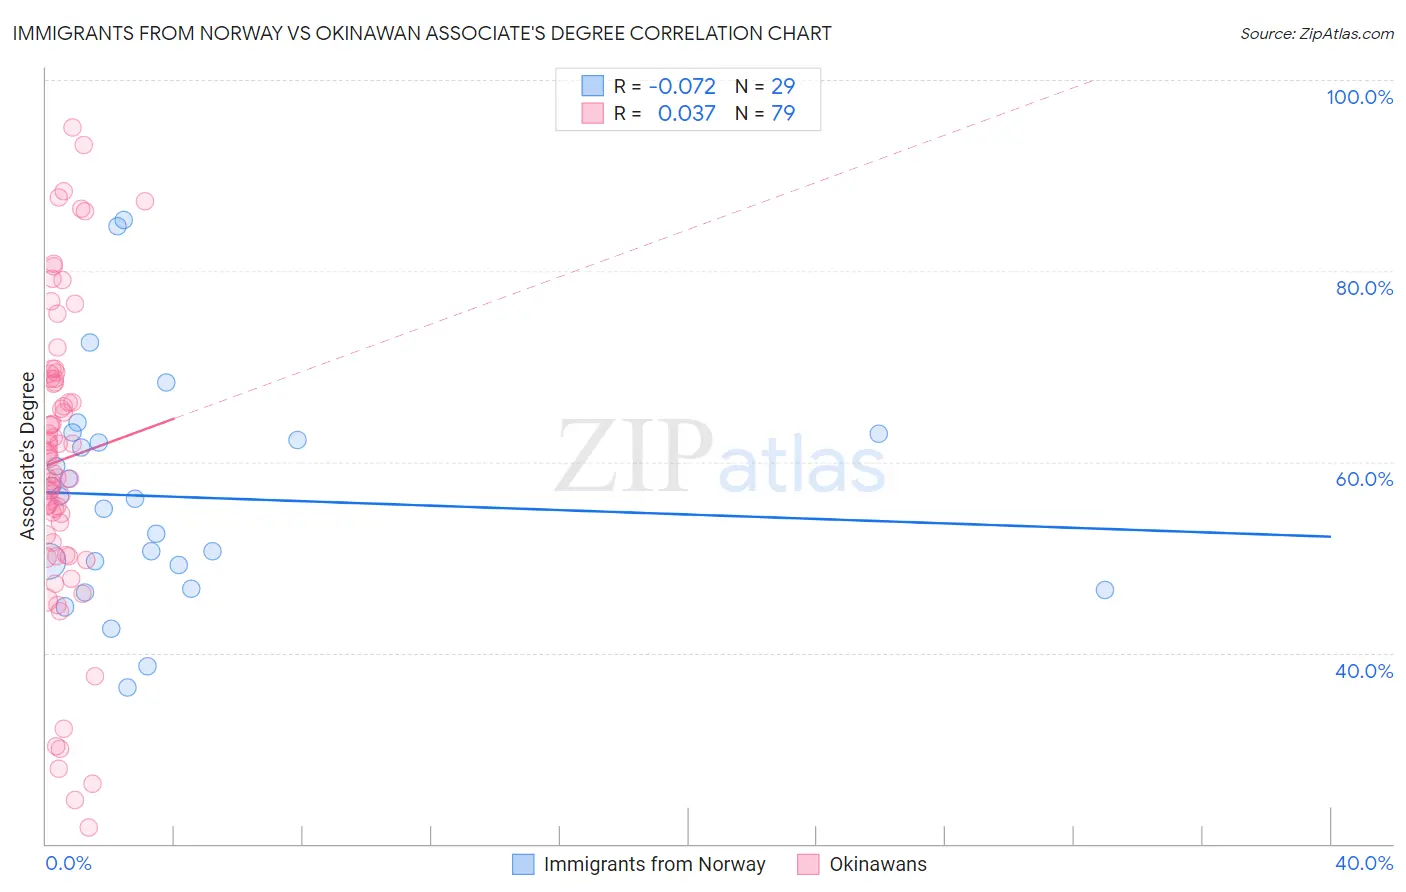
Immigrants from Norway vs Okinawan Associate's Degree Correlation Chart

The statistical analysis conducted on geographies consisting of 116,713,778 people shows a slight negative correlation between the proportion of Immigrants from Norway and percentage of population with at least associate's degree education in the United States with a correlation coefficient (R) of -0.072 and weighted average of 52.2%. Similarly, the statistical analysis conducted on geographies consisting of 73,779,368 people shows no correlation between the proportion of Okinawans and percentage of population with at least associate's degree education in the United States with a correlation coefficient (R) of 0.037 and weighted average of 57.7%, a difference of 10.4%.
Immigrants from Norway vs Okinawan Associate's Degree

Associate's Degree Correlation Summary

MeasurementImmigrants from NorwayOkinawan
Minimum36.3%21.7%
Maximum85.3%95.0%
Range49.0%73.3%
Mean56.3%60.2%
Median56.2%60.7%
Interquartile 25% (IQ1)47.9%51.5%
Interquartile 75% (IQ3)62.6%68.7%
Interquartile Range (IQR)14.7%17.1%
Standard Deviation (Sample)11.7%15.8%
Standard Deviation (Population)11.5%15.7%

Similar Demographics by Associate's Degree

Demographics Similar to Immigrants from Norway by Associate's Degree

In terms of associate's degree, the demographic groups most similar to Immigrants from Norway are Immigrants from Austria (52.1%, a difference of 0.20%), Asian (52.1%, a difference of 0.21%), Immigrants from Kuwait (52.4%, a difference of 0.26%), Immigrants from Bulgaria (52.4%, a difference of 0.27%), and Immigrants from Greece (52.1%, a difference of 0.29%).
DemographicsRating | RankAssociate's Degree
Immigrants | Saudi Arabia
99.9
/100
|
#41
Exceptional
52.6%
Immigrants | Malaysia
99.9
/100
|
#42
Exceptional
52.5%
Immigrants | South Africa
99.9
/100
|
#43
Exceptional
52.5%
Estonians
99.9
/100
|
#44
Exceptional
52.5%
Immigrants | Lithuania
99.9
/100
|
#45
Exceptional
52.4%
Immigrants | Bulgaria
99.9
/100
|
#46
Exceptional
52.4%
Immigrants | Kuwait
99.9
/100
|
#47
Exceptional
52.4%
Immigrants | Norway
99.9
/100
|
#48
Exceptional
52.2%
Immigrants | Austria
99.9
/100
|
#49
Exceptional
52.1%
Asians
99.9
/100
|
#50
Exceptional
52.1%
Immigrants | Greece
99.9
/100
|
#51
Exceptional
52.1%
Bolivians
99.8
/100
|
#52
Exceptional
52.0%
Immigrants | Asia
99.8
/100
|
#53
Exceptional
52.0%
Immigrants | Spain
99.8
/100
|
#54
Exceptional
51.9%
Australians
99.8
/100
|
#55
Exceptional
51.9%

Demographics Similar to Okinawans by Associate's Degree

In terms of associate's degree, the demographic groups most similar to Okinawans are Immigrants from Iran (57.7%, a difference of 0.060%), Thai (57.4%, a difference of 0.46%), Iranian (58.2%, a difference of 0.83%), Immigrants from Taiwan (58.4%, a difference of 1.2%), and Immigrants from India (58.5%, a difference of 1.5%).
DemographicsRating | RankAssociate's Degree
Filipinos
100.0
/100
|
#1
Exceptional
59.8%
Immigrants | Singapore
100.0
/100
|
#2
Exceptional
58.9%
Immigrants | India
100.0
/100
|
#3
Exceptional
58.5%
Immigrants | Taiwan
100.0
/100
|
#4
Exceptional
58.4%
Iranians
100.0
/100
|
#5
Exceptional
58.2%
Okinawans
100.0
/100
|
#6
Exceptional
57.7%
Immigrants | Iran
100.0
/100
|
#7
Exceptional
57.7%
Thais
100.0
/100
|
#8
Exceptional
57.4%
Immigrants | Israel
100.0
/100
|
#9
Exceptional
56.8%
Cypriots
100.0
/100
|
#10
Exceptional
56.4%
Immigrants | Australia
100.0
/100
|
#11
Exceptional
55.8%
Immigrants | South Central Asia
100.0
/100
|
#12
Exceptional
55.7%
Immigrants | China
100.0
/100
|
#13
Exceptional
55.5%
Immigrants | Hong Kong
100.0
/100
|
#14
Exceptional
55.4%
Immigrants | Eastern Asia
100.0
/100
|
#15
Exceptional
55.4%