Immigrants from Northern Europe vs Immigrants from Switzerland Nursery School
COMPARE
Immigrants from Northern Europe
Immigrants from Switzerland
Nursery School
Nursery School Comparison
Immigrants from Northern Europe
Immigrants from Switzerland
98.4%
NURSERY SCHOOL
99.6/ 100
METRIC RATING
67th/ 347
METRIC RANK
98.2%
NURSERY SCHOOL
97.3/ 100
METRIC RATING
106th/ 347
METRIC RANK
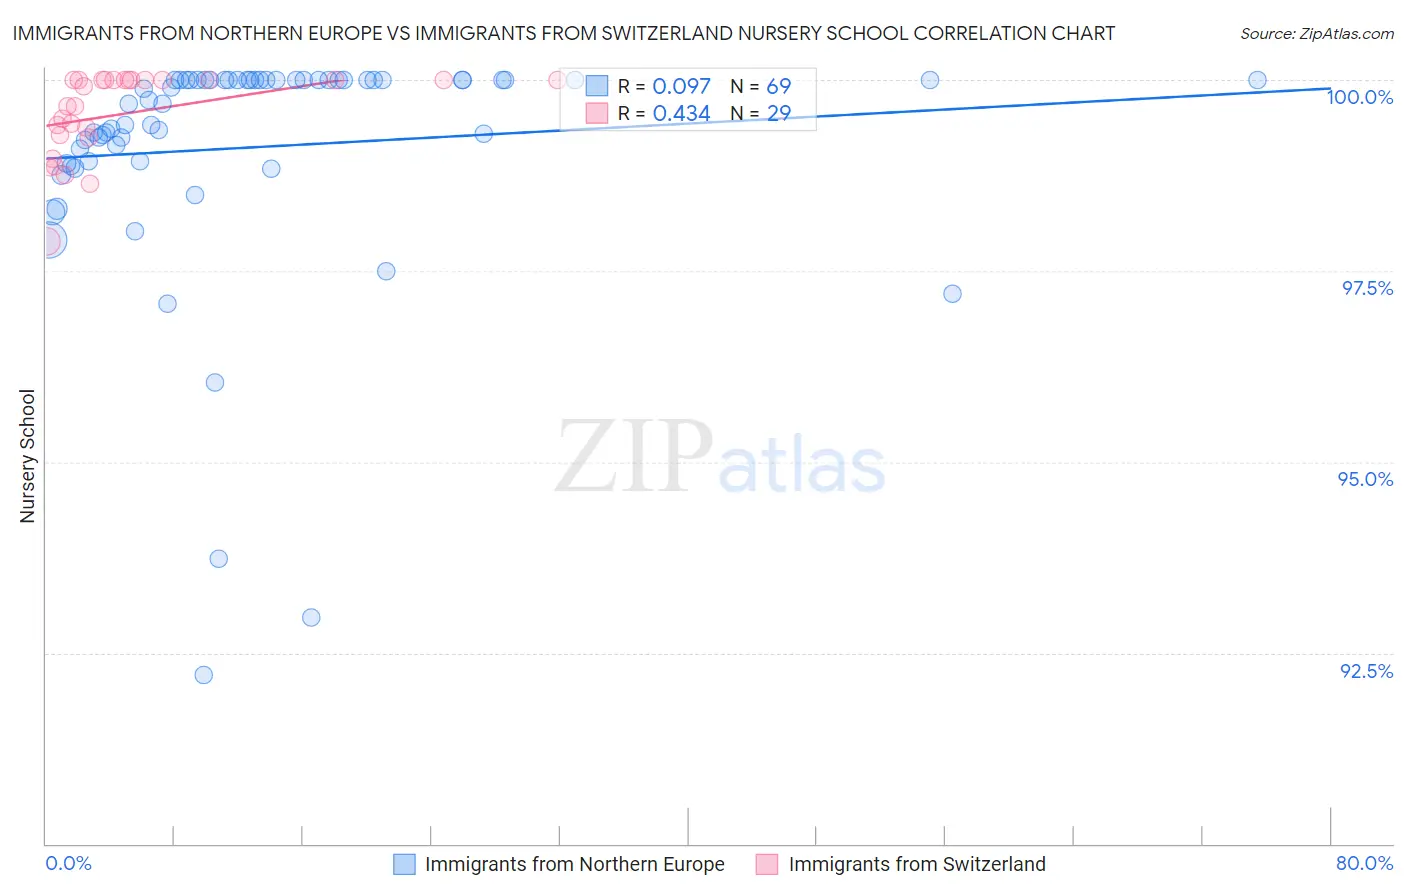
Immigrants from Northern Europe vs Immigrants from Switzerland Nursery School Correlation Chart
The statistical analysis conducted on geographies consisting of 477,226,800 people shows a slight positive correlation between the proportion of Immigrants from Northern Europe and percentage of population with at least nursery school education in the United States with a correlation coefficient (R) of 0.097 and weighted average of 98.4%. Similarly, the statistical analysis conducted on geographies consisting of 148,082,451 people shows a moderate positive correlation between the proportion of Immigrants from Switzerland and percentage of population with at least nursery school education in the United States with a correlation coefficient (R) of 0.434 and weighted average of 98.2%, a difference of 0.15%.
Nursery School Correlation Summary
| Measurement | Immigrants from Northern Europe | Immigrants from Switzerland |
| Minimum | 92.2% | 97.9% |
| Maximum | 100.0% | 100.0% |
| Range | 7.8% | 2.1% |
| Mean | 99.1% | 99.6% |
| Median | 99.7% | 99.9% |
| Interquartile 25% (IQ1) | 98.9% | 99.3% |
| Interquartile 75% (IQ3) | 100.0% | 100.0% |
| Interquartile Range (IQR) | 1.1% | 0.74% |
| Standard Deviation (Sample) | 1.6% | 0.56% |
| Standard Deviation (Population) | 1.6% | 0.55% |
Similar Demographics by Nursery School
Demographics Similar to Immigrants from Northern Europe by Nursery School
In terms of nursery school, the demographic groups most similar to Immigrants from Northern Europe are Canadian (98.4%, a difference of 0.0%), Russian (98.4%, a difference of 0.0%), Immigrants from Austria (98.4%, a difference of 0.0%), Cheyenne (98.4%, a difference of 0.0%), and Serbian (98.4%, a difference of 0.010%).
| Demographics | Rating | Rank | Nursery School |
| Slavs | 99.8 /100 | #60 | Exceptional 98.4% |
| New Zealanders | 99.7 /100 | #61 | Exceptional 98.4% |
| Creek | 99.7 /100 | #62 | Exceptional 98.4% |
| Immigrants | North America | 99.7 /100 | #63 | Exceptional 98.4% |
| Greeks | 99.7 /100 | #64 | Exceptional 98.4% |
| Maltese | 99.7 /100 | #65 | Exceptional 98.4% |
| Canadians | 99.7 /100 | #66 | Exceptional 98.4% |
| Immigrants | Northern Europe | 99.6 /100 | #67 | Exceptional 98.4% |
| Russians | 99.6 /100 | #68 | Exceptional 98.4% |
| Immigrants | Austria | 99.6 /100 | #69 | Exceptional 98.4% |
| Cheyenne | 99.6 /100 | #70 | Exceptional 98.4% |
| Serbians | 99.6 /100 | #71 | Exceptional 98.4% |
| Chickasaw | 99.6 /100 | #72 | Exceptional 98.4% |
| Cajuns | 99.4 /100 | #73 | Exceptional 98.4% |
| Immigrants | Netherlands | 99.4 /100 | #74 | Exceptional 98.4% |
Demographics Similar to Immigrants from Switzerland by Nursery School
In terms of nursery school, the demographic groups most similar to Immigrants from Switzerland are Bhutanese (98.2%, a difference of 0.0%), Turkish (98.2%, a difference of 0.0%), Basque (98.2%, a difference of 0.0%), Immigrants from Ireland (98.3%, a difference of 0.010%), and Cree (98.3%, a difference of 0.010%).
| Demographics | Rating | Rank | Nursery School |
| Colville | 98.2 /100 | #99 | Exceptional 98.3% |
| Puget Sound Salish | 98.0 /100 | #100 | Exceptional 98.3% |
| Romanians | 97.9 /100 | #101 | Exceptional 98.3% |
| Immigrants | Ireland | 97.7 /100 | #102 | Exceptional 98.3% |
| Cree | 97.7 /100 | #103 | Exceptional 98.3% |
| Bhutanese | 97.4 /100 | #104 | Exceptional 98.2% |
| Turks | 97.4 /100 | #105 | Exceptional 98.2% |
| Immigrants | Switzerland | 97.3 /100 | #106 | Exceptional 98.2% |
| Basques | 97.3 /100 | #107 | Exceptional 98.2% |
| Pima | 97.1 /100 | #108 | Exceptional 98.2% |
| German Russians | 97.1 /100 | #109 | Exceptional 98.2% |
| Immigrants | Singapore | 96.9 /100 | #110 | Exceptional 98.2% |
| Immigrants | Czechoslovakia | 96.8 /100 | #111 | Exceptional 98.2% |
| Immigrants | Norway | 96.6 /100 | #112 | Exceptional 98.2% |
| Immigrants | Latvia | 96.4 /100 | #113 | Exceptional 98.2% |