Immigrants from Northern Africa vs Taiwanese Associate's Degree

COMPARE

Immigrants from Northern Africa
Race
Ancestry
AfghanAfricanAlaska NativeAlaskan AthabascanAlbanianAleutAlsatianAmericanApacheArabArapahoArgentineanArmenianAssyrian/Chaldean/SyriacAustralianAustrianBahamianBangladeshiBarbadianBasqueBelgianBelizeanBermudanBhutaneseBlackfeetBolivianBrazilianBritishBritish West IndianBulgarianBurmeseCajunCambodianCanadianCape VerdeanCarpatho RusynCelticCentral AmericanCentral American IndianCherokeeCheyenneChickasawChileanChineseChippewaChoctawColombianColvilleComancheCosta RicanCreeCreekCroatianCrowCubanCypriotCzechCzechoslovakianDanishDelawareDominicanDutchDutch West IndianEastern EuropeanEcuadorianEgyptianEnglishEstonianEthiopianEuropeanFijianFilipinoFinnishFrenchFrench American IndianFrench CanadianGermanGerman RussianGhanaianGreekGuamanian/ChamorroGuatemalanGuyaneseHaitianHmongHonduranHopiHoumaHungarianIcelanderIndian (Asian)IndonesianInupiatIranianIraqiIrishIroquoisIsraeliItalianJamaicanJapaneseJordanianKenyanKiowaKoreanLaotianLatvianLebaneseLiberianLithuanianLumbeeLuxembourgerMacedonianMalaysianMalteseMarshalleseMenomineeMexicanMexican American IndianMongolianMoroccanNative HawaiianNavajoNepaleseNew ZealanderNicaraguanNigerianNorthern EuropeanNorwegianOkinawanOsageOttawaPaiutePakistaniPalestinianPanamanianParaguayanPennsylvania GermanPeruvianPimaPolishPortuguesePotawatomiPuebloPuerto RicanPuget Sound SalishRomanianRussianSalvadoranSamoanScandinavianScotch-IrishScottishSeminoleSenegaleseSerbianShoshoneSierra LeoneanSiouxSlavicSlovakSloveneSomaliSouth AfricanSouth AmericanSouth American IndianSoviet UnionSpaniardSpanishSpanish AmericanSpanish American IndianSri LankanSubsaharan AfricanSudaneseSwedishSwissSyrianThaiTlingit-HaidaTohono O'OdhamTonganTrinidadian and TobagonianTsimshianTurkishU.S. Virgin IslanderUgandanUkrainianUruguayanUteVenezuelanVietnameseWelshWest IndianYakamaYaquiYugoslavianYumanYup'ikZimbabwean
Immigration
NonimmigrantsImmigrantsAfghanistanAfricaAlbaniaArgentinaArmeniaAsiaAustraliaAustriaBahamasBangladeshBarbadosBelarusBelgiumBelizeBoliviaBosnia and HerzegovinaBrazilBulgariaBurma/MyanmarCabo VerdeCambodiaCameroonCanadaCaribbeanCentral AmericaChileChinaColombiaCongoCosta RicaCroatiaCubaCzechoslovakiaDenmarkDominicaDominican RepublicEastern AfricaEastern AsiaEastern EuropeEcuadorEgyptEl SalvadorEnglandEritreaEthiopiaEuropeFijiFranceGermanyGhanaGreeceGrenadaGuatemalaGuyanaHaitiHondurasHong KongHungaryIndiaIndonesiaIranIraqIrelandIsraelItalyJamaicaJapanJordanKazakhstanKenyaKoreaKuwaitLaosLatin AmericaLatviaLebanonLiberiaLithuaniaMalaysiaMexicoMicronesiaMiddle AfricaMoldovaMoroccoNepalNetherlandsNicaraguaNigeriaNorth AmericaNorth MacedoniaNorthern AfricaNorthern EuropeNorwayOceaniaPakistanPanamaPeruPhilippinesPolandPortugalRomaniaRussiaSaudi ArabiaScotlandSenegalSerbiaSierra LeoneSingaporeSomaliaSouth AfricaSouth AmericaSouth Central AsiaSouth Eastern AsiaSouthern EuropeSpainSri LankaSt. Vincent and the GrenadinesSudanSwedenSwitzerlandSyriaTaiwanThailandTrinidad and TobagoTurkeyUgandaUkraineUruguayUzbekistanVenezuelaVietnamWest IndiesWestern AfricaWestern AsiaWestern EuropeYemenZaireZimbabweAzores
Taiwanese
Race
Ancestry
AfghanAfricanAlaska NativeAlaskan AthabascanAlbanianAleutAlsatianAmericanApacheArabArapahoArgentineanArmenianAssyrian/Chaldean/SyriacAustralianAustrianBahamianBangladeshiBarbadianBasqueBelgianBelizeanBermudanBhutaneseBlackfeetBolivianBrazilianBritishBritish West IndianBulgarianBurmeseCajunCambodianCanadianCape VerdeanCarpatho RusynCelticCentral AmericanCentral American IndianCherokeeCheyenneChickasawChileanChineseChippewaChoctawColombianColvilleComancheCosta RicanCreeCreekCroatianCrowCubanCypriotCzechCzechoslovakianDanishDelawareDominicanDutchDutch West IndianEastern EuropeanEcuadorianEgyptianEnglishEstonianEthiopianEuropeanFijianFilipinoFinnishFrenchFrench American IndianFrench CanadianGermanGerman RussianGhanaianGreekGuamanian/ChamorroGuatemalanGuyaneseHaitianHmongHonduranHopiHoumaHungarianIcelanderIndian (Asian)IndonesianInupiatIranianIraqiIrishIroquoisIsraeliItalianJamaicanJapaneseJordanianKenyanKiowaKoreanLaotianLatvianLebaneseLiberianLithuanianLumbeeLuxembourgerMacedonianMalaysianMalteseMarshalleseMenomineeMexicanMexican American IndianMongolianMoroccanNative HawaiianNavajoNepaleseNew ZealanderNicaraguanNigerianNorthern EuropeanNorwegianOkinawanOsageOttawaPaiutePakistaniPalestinianPanamanianParaguayanPennsylvania GermanPeruvianPimaPolishPortuguesePotawatomiPuebloPuerto RicanPuget Sound SalishRomanianRussianSalvadoranSamoanScandinavianScotch-IrishScottishSeminoleSenegaleseSerbianShoshoneSierra LeoneanSiouxSlavicSlovakSloveneSomaliSouth AfricanSouth AmericanSouth American IndianSoviet UnionSpaniardSpanishSpanish AmericanSpanish American IndianSri LankanSubsaharan AfricanSudaneseSwedishSwissSyrianTaiwaneseThaiTlingit-HaidaTohono O'OdhamTonganTrinidadian and TobagonianTsimshianTurkishU.S. Virgin IslanderUgandanUkrainianUruguayanUteVenezuelanVietnameseWelshWest IndianYakamaYaquiYugoslavianYumanYup'ikZimbabwean
Immigration
NonimmigrantsImmigrantsAfghanistanAfricaAlbaniaArgentinaArmeniaAsiaAustraliaAustriaBahamasBangladeshBarbadosBelarusBelgiumBelizeBoliviaBosnia and HerzegovinaBrazilBulgariaBurma/MyanmarCabo VerdeCambodiaCameroonCanadaCaribbeanCentral AmericaChileChinaColombiaCongoCosta RicaCroatiaCubaCzechoslovakiaDenmarkDominicaDominican RepublicEastern AfricaEastern AsiaEastern EuropeEcuadorEgyptEl SalvadorEnglandEritreaEthiopiaEuropeFijiFranceGermanyGhanaGreeceGrenadaGuatemalaGuyanaHaitiHondurasHong KongHungaryIndiaIndonesiaIranIraqIrelandIsraelItalyJamaicaJapanJordanKazakhstanKenyaKoreaKuwaitLaosLatin AmericaLatviaLebanonLiberiaLithuaniaMalaysiaMexicoMicronesiaMiddle AfricaMoldovaMoroccoNepalNetherlandsNicaraguaNigeriaNorth AmericaNorth MacedoniaNorthern EuropeNorwayOceaniaPakistanPanamaPeruPhilippinesPolandPortugalRomaniaRussiaSaudi ArabiaScotlandSenegalSerbiaSierra LeoneSingaporeSomaliaSouth AfricaSouth AmericaSouth Central AsiaSouth Eastern AsiaSouthern EuropeSpainSri LankaSt. Vincent and the GrenadinesSudanSwedenSwitzerlandSyriaTaiwanThailandTrinidad and TobagoTurkeyUgandaUkraineUruguayUzbekistanVenezuelaVietnamWest IndiesWestern AfricaWestern AsiaWestern EuropeYemenZaireZimbabweAzores
Associate's Degree
Income
Poverty
Unemployment
Labor Participation
Family Structure
Vehicle Availability
Education Level
Disability

Associate's Degree Comparison

Immigrants from Northern Africa

Taiwanese

Exceptional
Excellent
49.7%
ASSOCIATE'S DEGREE
97.9/ 100
METRIC RATING
98th/ 347
METRIC RANK
47.7%
ASSOCIATE'S DEGREE
83.3/ 100
METRIC RATING
141st/ 347
METRIC RANK

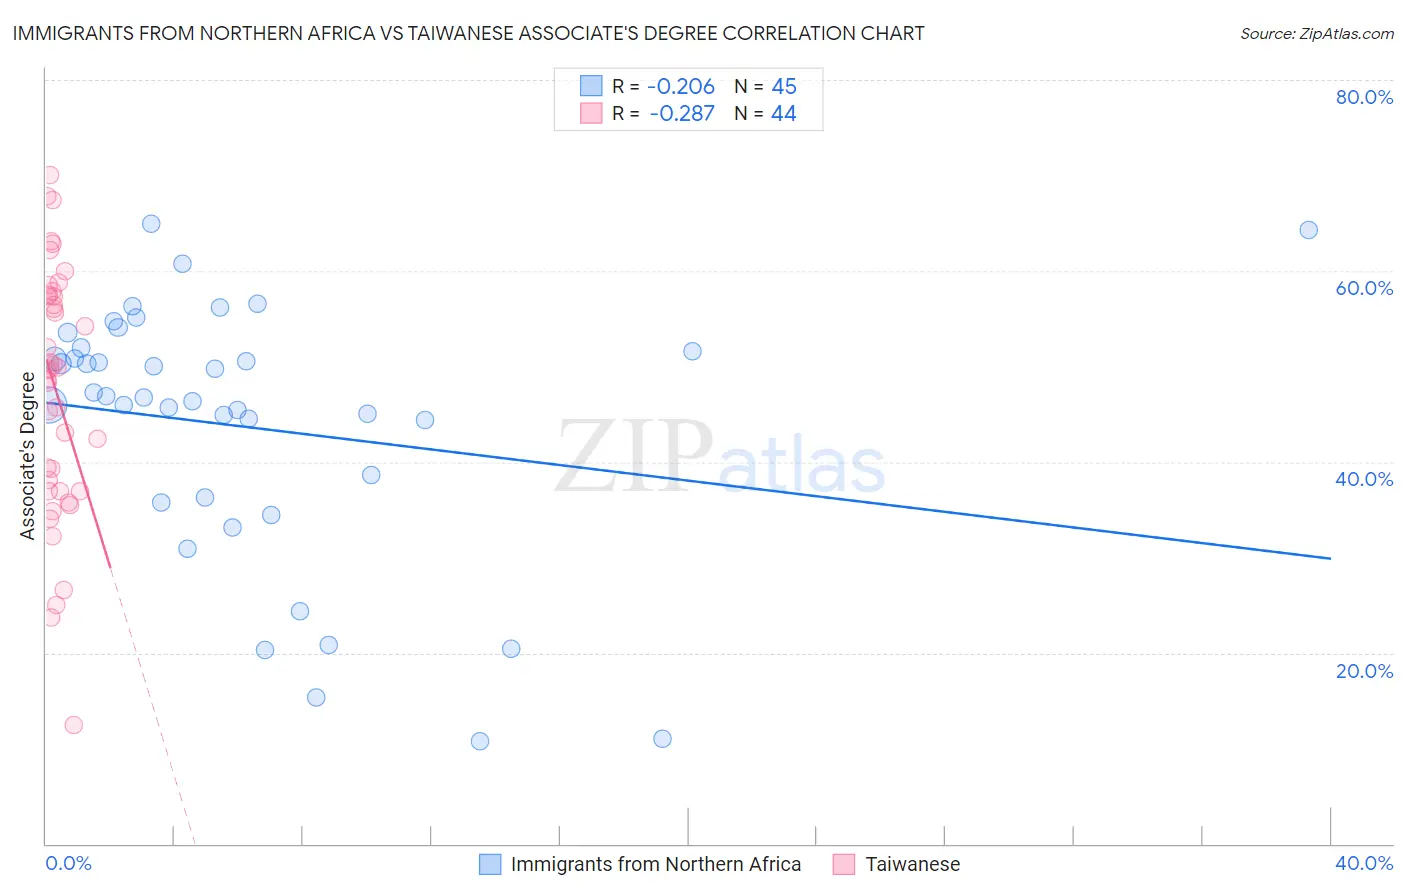
Immigrants from Northern Africa vs Taiwanese Associate's Degree Correlation Chart

The statistical analysis conducted on geographies consisting of 321,197,052 people shows a weak negative correlation between the proportion of Immigrants from Northern Africa and percentage of population with at least associate's degree education in the United States with a correlation coefficient (R) of -0.206 and weighted average of 49.7%. Similarly, the statistical analysis conducted on geographies consisting of 31,724,936 people shows a weak negative correlation between the proportion of Taiwanese and percentage of population with at least associate's degree education in the United States with a correlation coefficient (R) of -0.287 and weighted average of 47.7%, a difference of 4.1%.
Immigrants from Northern Africa vs Taiwanese Associate's Degree

Associate's Degree Correlation Summary

MeasurementImmigrants from Northern AfricaTaiwanese
Minimum10.8%12.5%
Maximum65.0%70.0%
Range54.2%57.5%
Mean43.6%47.4%
Median46.7%49.7%
Interquartile 25% (IQ1)36.0%36.9%
Interquartile 75% (IQ3)51.8%57.5%
Interquartile Range (IQR)15.8%20.5%
Standard Deviation (Sample)13.6%13.1%
Standard Deviation (Population)13.4%12.9%

Similar Demographics by Associate's Degree

Demographics Similar to Immigrants from Northern Africa by Associate's Degree

In terms of associate's degree, the demographic groups most similar to Immigrants from Northern Africa are Macedonian (49.6%, a difference of 0.070%), Romanian (49.7%, a difference of 0.090%), Immigrants from Ukraine (49.7%, a difference of 0.090%), Immigrants from England (49.7%, a difference of 0.11%), and Immigrants from Nepal (49.5%, a difference of 0.28%).
DemographicsRating | RankAssociate's Degree
Immigrants | Western Asia
98.7
/100
|
#91
Exceptional
50.1%
Immigrants | North America
98.7
/100
|
#92
Exceptional
50.1%
Immigrants | Brazil
98.5
/100
|
#93
Exceptional
50.0%
Laotians
98.4
/100
|
#94
Exceptional
49.9%
Immigrants | England
98.0
/100
|
#95
Exceptional
49.7%
Romanians
98.0
/100
|
#96
Exceptional
49.7%
Immigrants | Ukraine
98.0
/100
|
#97
Exceptional
49.7%
Immigrants | Northern Africa
97.9
/100
|
#98
Exceptional
49.7%
Macedonians
97.8
/100
|
#99
Exceptional
49.6%
Immigrants | Nepal
97.5
/100
|
#100
Exceptional
49.5%
Northern Europeans
97.3
/100
|
#101
Exceptional
49.5%
Chileans
97.3
/100
|
#102
Exceptional
49.4%
Ukrainians
97.1
/100
|
#103
Exceptional
49.4%
Venezuelans
97.0
/100
|
#104
Exceptional
49.4%
Croatians
96.8
/100
|
#105
Exceptional
49.3%

Demographics Similar to Taiwanese by Associate's Degree

In terms of associate's degree, the demographic groups most similar to Taiwanese are Sierra Leonean (47.7%, a difference of 0.050%), Immigrants from Southern Europe (47.8%, a difference of 0.15%), Slovene (47.9%, a difference of 0.24%), Norwegian (47.6%, a difference of 0.28%), and Slavic (47.6%, a difference of 0.34%).
DemographicsRating | RankAssociate's Degree
Moroccans
89.3
/100
|
#134
Excellent
48.2%
Europeans
89.0
/100
|
#135
Excellent
48.2%
Pakistanis
88.0
/100
|
#136
Excellent
48.1%
Immigrants | Eritrea
87.8
/100
|
#137
Excellent
48.1%
Poles
87.3
/100
|
#138
Excellent
48.0%
Slovenes
85.1
/100
|
#139
Excellent
47.9%
Immigrants | Southern Europe
84.4
/100
|
#140
Excellent
47.8%
Taiwanese
83.3
/100
|
#141
Excellent
47.7%
Sierra Leoneans
82.9
/100
|
#142
Excellent
47.7%
Norwegians
81.0
/100
|
#143
Excellent
47.6%
Slavs
80.5
/100
|
#144
Excellent
47.6%
Canadians
79.0
/100
|
#145
Good
47.5%
Immigrants | Sudan
77.9
/100
|
#146
Good
47.4%
Danes
77.3
/100
|
#147
Good
47.4%
South American Indians
76.7
/100
|
#148
Good
47.4%