Immigrants from Northern Africa vs Indonesian 2nd Grade
COMPARE
Immigrants from Northern Africa
Indonesian
2nd Grade
2nd Grade Comparison
Immigrants from Northern Africa
Indonesians
97.7%
2ND GRADE
12.3/ 100
METRIC RATING
208th/ 347
METRIC RANK
96.7%
2ND GRADE
0.0/ 100
METRIC RATING
318th/ 347
METRIC RANK
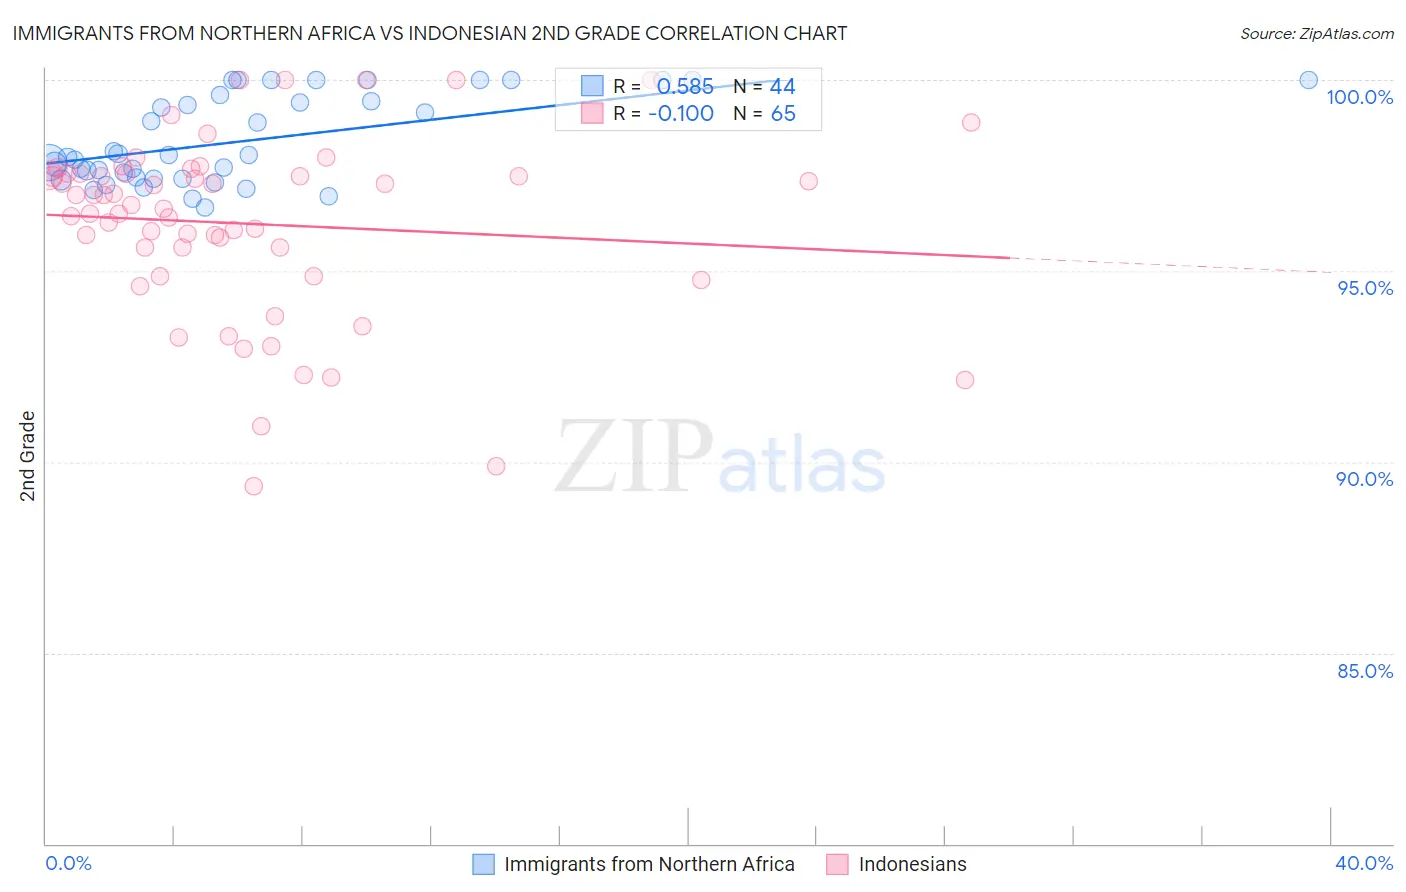
Immigrants from Northern Africa vs Indonesian 2nd Grade Correlation Chart
The statistical analysis conducted on geographies consisting of 321,196,768 people shows a substantial positive correlation between the proportion of Immigrants from Northern Africa and percentage of population with at least 2nd grade education in the United States with a correlation coefficient (R) of 0.585 and weighted average of 97.7%. Similarly, the statistical analysis conducted on geographies consisting of 162,707,412 people shows a poor negative correlation between the proportion of Indonesians and percentage of population with at least 2nd grade education in the United States with a correlation coefficient (R) of -0.100 and weighted average of 96.7%, a difference of 1.0%.
2nd Grade Correlation Summary
| Measurement | Immigrants from Northern Africa | Indonesian |
| Minimum | 96.7% | 89.4% |
| Maximum | 100.0% | 100.0% |
| Range | 3.3% | 10.6% |
| Mean | 98.4% | 96.2% |
| Median | 98.0% | 96.7% |
| Interquartile 25% (IQ1) | 97.4% | 95.2% |
| Interquartile 75% (IQ3) | 99.5% | 97.5% |
| Interquartile Range (IQR) | 2.1% | 2.3% |
| Standard Deviation (Sample) | 1.1% | 2.4% |
| Standard Deviation (Population) | 1.1% | 2.3% |
Similar Demographics by 2nd Grade
Demographics Similar to Immigrants from Northern Africa by 2nd Grade
In terms of 2nd grade, the demographic groups most similar to Immigrants from Northern Africa are Immigrants from Oceania (97.7%, a difference of 0.010%), Costa Rican (97.7%, a difference of 0.010%), African (97.7%, a difference of 0.020%), Laotian (97.7%, a difference of 0.020%), and Immigrants from Chile (97.7%, a difference of 0.030%).
| Demographics | Rating | Rank | 2nd Grade |
| Tohono O'odham | 20.9 /100 | #201 | Fair 97.8% |
| Immigrants | Ukraine | 20.5 /100 | #202 | Fair 97.8% |
| Yuman | 20.0 /100 | #203 | Fair 97.8% |
| Immigrants | Albania | 18.4 /100 | #204 | Poor 97.8% |
| Immigrants | Southern Europe | 18.1 /100 | #205 | Poor 97.8% |
| Immigrants | Chile | 17.3 /100 | #206 | Poor 97.7% |
| Africans | 15.6 /100 | #207 | Poor 97.7% |
| Immigrants | Northern Africa | 12.3 /100 | #208 | Poor 97.7% |
| Immigrants | Oceania | 10.9 /100 | #209 | Poor 97.7% |
| Costa Ricans | 10.5 /100 | #210 | Poor 97.7% |
| Laotians | 9.9 /100 | #211 | Tragic 97.7% |
| Immigrants | Bahamas | 8.4 /100 | #212 | Tragic 97.7% |
| Moroccans | 8.2 /100 | #213 | Tragic 97.7% |
| Samoans | 7.1 /100 | #214 | Tragic 97.7% |
| Bahamians | 6.8 /100 | #215 | Tragic 97.7% |
Demographics Similar to Indonesians by 2nd Grade
In terms of 2nd grade, the demographic groups most similar to Indonesians are Honduran (96.7%, a difference of 0.0%), Immigrants from Laos (96.7%, a difference of 0.0%), Immigrants from Nicaragua (96.7%, a difference of 0.0%), Immigrants from Belize (96.8%, a difference of 0.010%), and Immigrants from Guyana (96.7%, a difference of 0.010%).
| Demographics | Rating | Rank | 2nd Grade |
| Guyanese | 0.0 /100 | #311 | Tragic 96.8% |
| Cape Verdeans | 0.0 /100 | #312 | Tragic 96.8% |
| Hispanics or Latinos | 0.0 /100 | #313 | Tragic 96.8% |
| Immigrants | Ecuador | 0.0 /100 | #314 | Tragic 96.8% |
| Immigrants | Belize | 0.0 /100 | #315 | Tragic 96.8% |
| Hondurans | 0.0 /100 | #316 | Tragic 96.7% |
| Immigrants | Laos | 0.0 /100 | #317 | Tragic 96.7% |
| Indonesians | 0.0 /100 | #318 | Tragic 96.7% |
| Immigrants | Nicaragua | 0.0 /100 | #319 | Tragic 96.7% |
| Immigrants | Guyana | 0.0 /100 | #320 | Tragic 96.7% |
| Immigrants | Burma/Myanmar | 0.0 /100 | #321 | Tragic 96.7% |
| Immigrants | Bangladesh | 0.0 /100 | #322 | Tragic 96.7% |
| Vietnamese | 0.0 /100 | #323 | Tragic 96.7% |
| Mexican American Indians | 0.0 /100 | #324 | Tragic 96.7% |
| Dominicans | 0.0 /100 | #325 | Tragic 96.6% |