Immigrants from North Macedonia vs Immigrants from Italy Kindergarten
COMPARE
Immigrants from North Macedonia
Immigrants from Italy
Kindergarten
Kindergarten Comparison
Immigrants from North Macedonia
Immigrants from Italy
98.0%
KINDERGARTEN
66.4/ 100
METRIC RATING
157th/ 347
METRIC RANK
98.0%
KINDERGARTEN
58.9/ 100
METRIC RATING
162nd/ 347
METRIC RANK
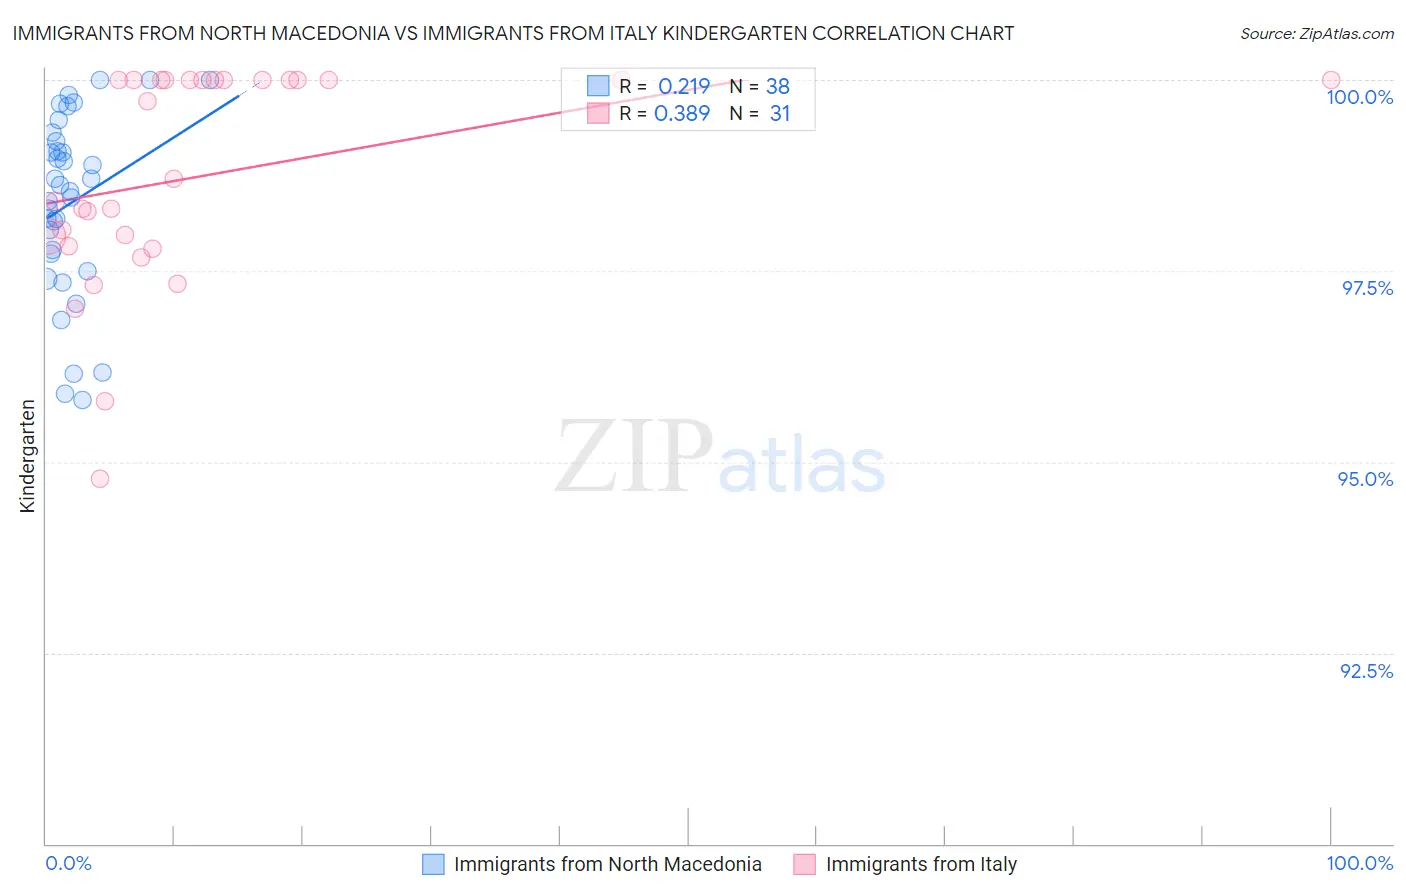
Immigrants from North Macedonia vs Immigrants from Italy Kindergarten Correlation Chart
The statistical analysis conducted on geographies consisting of 74,317,186 people shows a weak positive correlation between the proportion of Immigrants from North Macedonia and percentage of population with at least kindergarten education in the United States with a correlation coefficient (R) of 0.219 and weighted average of 98.0%. Similarly, the statistical analysis conducted on geographies consisting of 324,225,917 people shows a mild positive correlation between the proportion of Immigrants from Italy and percentage of population with at least kindergarten education in the United States with a correlation coefficient (R) of 0.389 and weighted average of 98.0%, a difference of 0.020%.
Kindergarten Correlation Summary
| Measurement | Immigrants from North Macedonia | Immigrants from Italy |
| Minimum | 95.8% | 94.8% |
| Maximum | 100.0% | 100.0% |
| Range | 4.2% | 5.2% |
| Mean | 98.4% | 98.7% |
| Median | 98.6% | 98.7% |
| Interquartile 25% (IQ1) | 97.7% | 97.8% |
| Interquartile 75% (IQ3) | 99.2% | 100.0% |
| Interquartile Range (IQR) | 1.5% | 2.2% |
| Standard Deviation (Sample) | 1.2% | 1.4% |
| Standard Deviation (Population) | 1.2% | 1.4% |
Demographics Similar to Immigrants from North Macedonia and Immigrants from Italy by Kindergarten
In terms of kindergarten, the demographic groups most similar to Immigrants from North Macedonia are Immigrants from South Central Asia (98.0%, a difference of 0.0%), Dutch West Indian (98.0%, a difference of 0.010%), Immigrants from Moldova (98.0%, a difference of 0.010%), Immigrants from Iran (98.0%, a difference of 0.010%), and Comanche (98.0%, a difference of 0.010%). Similarly, the demographic groups most similar to Immigrants from Italy are Immigrants from Russia (98.0%, a difference of 0.0%), Immigrants from Eastern Europe (98.0%, a difference of 0.0%), Spanish American (98.0%, a difference of 0.0%), Immigrants from Micronesia (98.0%, a difference of 0.0%), and Ugandan (98.0%, a difference of 0.010%).
| Demographics | Rating | Rank | Kindergarten |
| Immigrants | Greece | 74.9 /100 | #149 | Good 98.0% |
| Jordanians | 72.8 /100 | #150 | Good 98.0% |
| Soviet Union | 70.8 /100 | #151 | Good 98.0% |
| Dutch West Indians | 70.1 /100 | #152 | Good 98.0% |
| Immigrants | Moldova | 69.1 /100 | #153 | Good 98.0% |
| Immigrants | Iran | 68.8 /100 | #154 | Good 98.0% |
| Comanche | 68.3 /100 | #155 | Good 98.0% |
| Immigrants | South Central Asia | 66.6 /100 | #156 | Good 98.0% |
| Immigrants | North Macedonia | 66.4 /100 | #157 | Good 98.0% |
| Venezuelans | 64.7 /100 | #158 | Good 98.0% |
| French American Indians | 63.7 /100 | #159 | Good 98.0% |
| Immigrants | Russia | 59.0 /100 | #160 | Average 98.0% |
| Immigrants | Eastern Europe | 59.0 /100 | #161 | Average 98.0% |
| Immigrants | Italy | 58.9 /100 | #162 | Average 98.0% |
| Spanish Americans | 57.8 /100 | #163 | Average 98.0% |
| Immigrants | Micronesia | 57.7 /100 | #164 | Average 98.0% |
| Ugandans | 56.9 /100 | #165 | Average 98.0% |
| Chileans | 56.3 /100 | #166 | Average 98.0% |
| Immigrants | Spain | 54.6 /100 | #167 | Average 98.0% |
| Navajo | 54.4 /100 | #168 | Average 98.0% |
| Immigrants | Korea | 54.1 /100 | #169 | Average 98.0% |