Immigrants from North America vs Nepalese High School Diploma
COMPARE
Immigrants from North America
Nepalese
High School Diploma
High School Diploma Comparison
Immigrants from North America
Nepalese
91.0%
HIGH SCHOOL DIPLOMA
99.7/ 100
METRIC RATING
59th/ 347
METRIC RANK
85.3%
HIGH SCHOOL DIPLOMA
0.0/ 100
METRIC RATING
304th/ 347
METRIC RANK
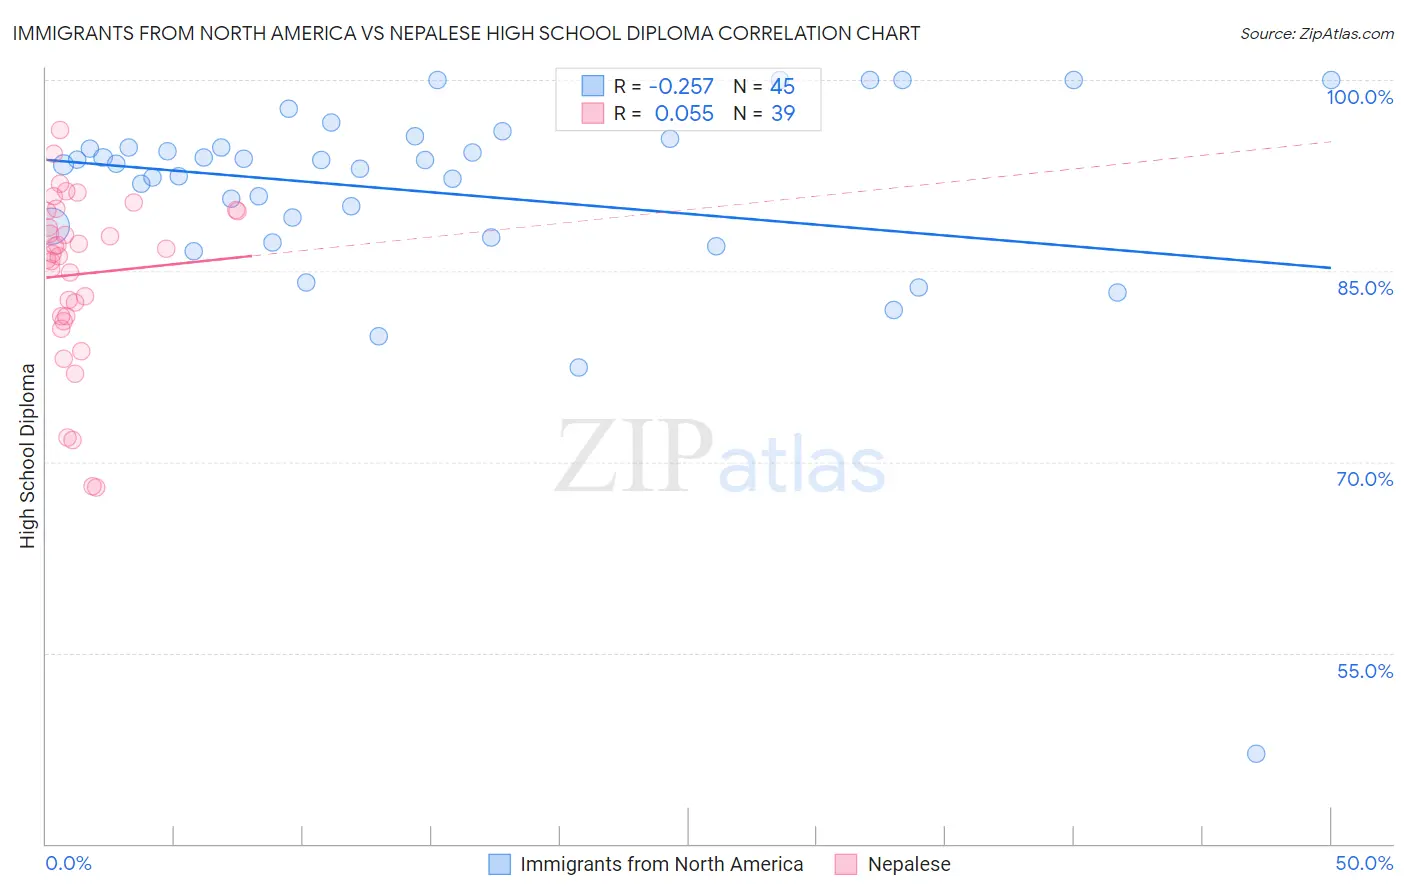
Immigrants from North America vs Nepalese High School Diploma Correlation Chart
The statistical analysis conducted on geographies consisting of 462,461,910 people shows a weak negative correlation between the proportion of Immigrants from North America and percentage of population with at least high school diploma education in the United States with a correlation coefficient (R) of -0.257 and weighted average of 91.0%. Similarly, the statistical analysis conducted on geographies consisting of 24,519,269 people shows a slight positive correlation between the proportion of Nepalese and percentage of population with at least high school diploma education in the United States with a correlation coefficient (R) of 0.055 and weighted average of 85.3%, a difference of 6.7%.
High School Diploma Correlation Summary
| Measurement | Immigrants from North America | Nepalese |
| Minimum | 47.1% | 67.9% |
| Maximum | 100.0% | 96.1% |
| Range | 52.9% | 28.2% |
| Mean | 91.1% | 84.7% |
| Median | 93.4% | 86.3% |
| Interquartile 25% (IQ1) | 88.1% | 81.5% |
| Interquartile 75% (IQ3) | 95.1% | 89.7% |
| Interquartile Range (IQR) | 7.0% | 8.3% |
| Standard Deviation (Sample) | 8.7% | 6.7% |
| Standard Deviation (Population) | 8.6% | 6.6% |
Similar Demographics by High School Diploma
Demographics Similar to Immigrants from North America by High School Diploma
In terms of high school diploma, the demographic groups most similar to Immigrants from North America are Slavic (91.0%, a difference of 0.0%), Zimbabwean (91.1%, a difference of 0.010%), Immigrants from Canada (91.1%, a difference of 0.030%), Immigrants from Japan (91.0%, a difference of 0.030%), and Immigrants from Taiwan (91.0%, a difference of 0.040%).
| Demographics | Rating | Rank | High School Diploma |
| Immigrants | Sweden | 99.7 /100 | #52 | Exceptional 91.1% |
| Immigrants | Belgium | 99.7 /100 | #53 | Exceptional 91.1% |
| Macedonians | 99.7 /100 | #54 | Exceptional 91.1% |
| Serbians | 99.7 /100 | #55 | Exceptional 91.1% |
| Immigrants | Canada | 99.7 /100 | #56 | Exceptional 91.1% |
| Zimbabweans | 99.7 /100 | #57 | Exceptional 91.1% |
| Slavs | 99.7 /100 | #58 | Exceptional 91.0% |
| Immigrants | North America | 99.7 /100 | #59 | Exceptional 91.0% |
| Immigrants | Japan | 99.6 /100 | #60 | Exceptional 91.0% |
| Immigrants | Taiwan | 99.6 /100 | #61 | Exceptional 91.0% |
| Austrians | 99.6 /100 | #62 | Exceptional 91.0% |
| Immigrants | Netherlands | 99.6 /100 | #63 | Exceptional 91.0% |
| Ukrainians | 99.6 /100 | #64 | Exceptional 91.0% |
| Immigrants | South Africa | 99.6 /100 | #65 | Exceptional 91.0% |
| French | 99.5 /100 | #66 | Exceptional 91.0% |
Demographics Similar to Nepalese by High School Diploma
In terms of high school diploma, the demographic groups most similar to Nepalese are Immigrants from Portugal (85.3%, a difference of 0.010%), Immigrants from Guyana (85.3%, a difference of 0.050%), Immigrants from Haiti (85.4%, a difference of 0.11%), Cuban (85.4%, a difference of 0.11%), and Navajo (85.2%, a difference of 0.14%).
| Demographics | Rating | Rank | High School Diploma |
| Immigrants | Grenada | 0.0 /100 | #297 | Tragic 85.6% |
| Natives/Alaskans | 0.0 /100 | #298 | Tragic 85.6% |
| Guyanese | 0.0 /100 | #299 | Tragic 85.5% |
| Immigrants | Bangladesh | 0.0 /100 | #300 | Tragic 85.5% |
| Vietnamese | 0.0 /100 | #301 | Tragic 85.4% |
| Immigrants | Haiti | 0.0 /100 | #302 | Tragic 85.4% |
| Cubans | 0.0 /100 | #303 | Tragic 85.4% |
| Nepalese | 0.0 /100 | #304 | Tragic 85.3% |
| Immigrants | Portugal | 0.0 /100 | #305 | Tragic 85.3% |
| Immigrants | Guyana | 0.0 /100 | #306 | Tragic 85.3% |
| Navajo | 0.0 /100 | #307 | Tragic 85.2% |
| Immigrants | Armenia | 0.0 /100 | #308 | Tragic 85.2% |
| Immigrants | Dominica | 0.0 /100 | #309 | Tragic 85.2% |
| Apache | 0.0 /100 | #310 | Tragic 85.1% |
| Ecuadorians | 0.0 /100 | #311 | Tragic 85.1% |