Immigrants from North America vs Immigrants from Malaysia 7th Grade
COMPARE
Immigrants from North America
Immigrants from Malaysia
7th Grade
7th Grade Comparison
Immigrants from North America
Immigrants from Malaysia
96.9%
7TH GRADE
99.8/ 100
METRIC RATING
62nd/ 347
METRIC RANK
95.6%
7TH GRADE
6.2/ 100
METRIC RATING
225th/ 347
METRIC RANK
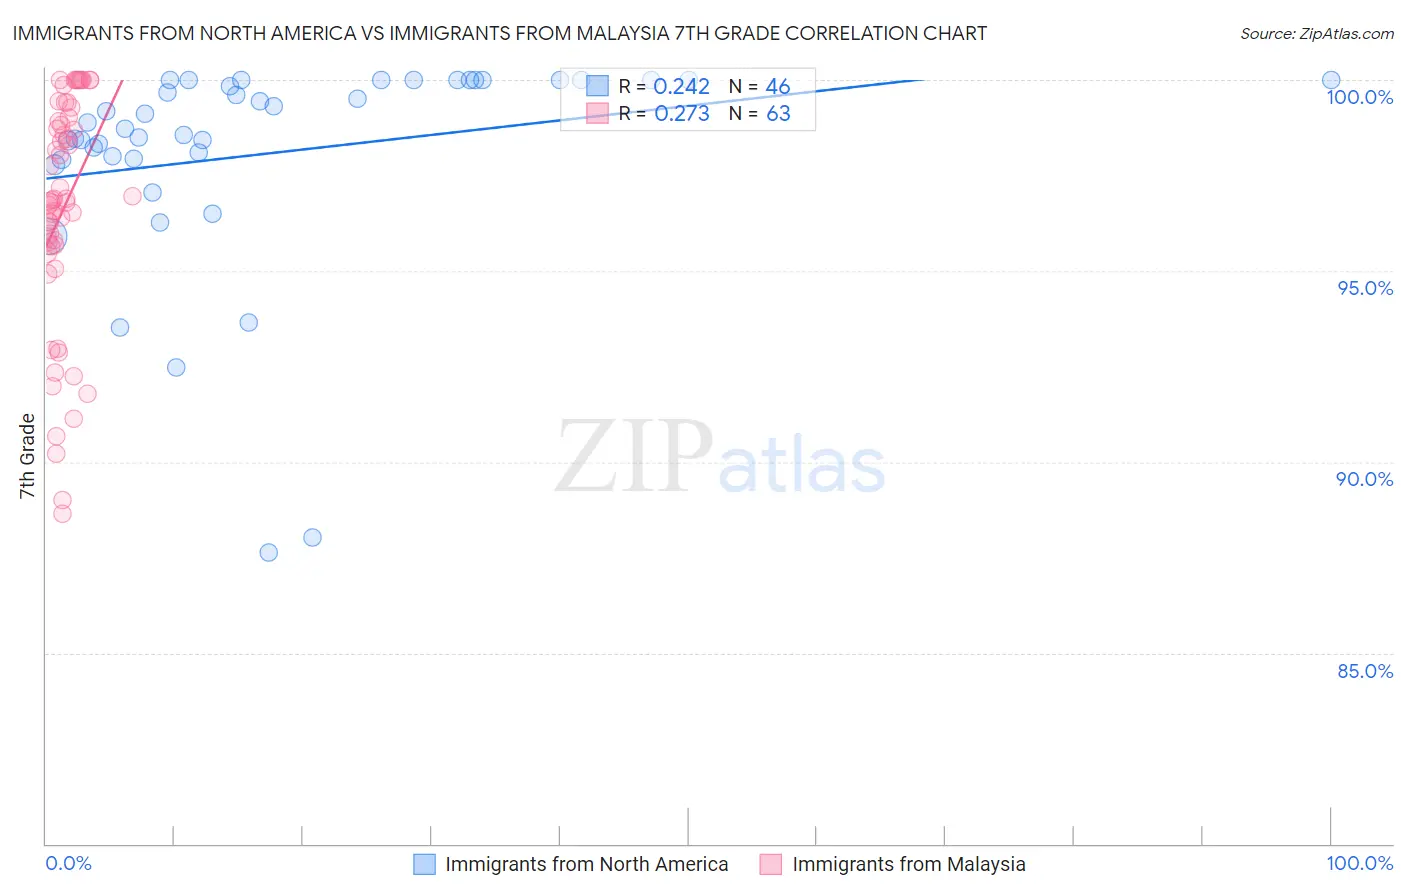
Immigrants from North America vs Immigrants from Malaysia 7th Grade Correlation Chart
The statistical analysis conducted on geographies consisting of 462,462,330 people shows a weak positive correlation between the proportion of Immigrants from North America and percentage of population with at least 7th grade education in the United States with a correlation coefficient (R) of 0.242 and weighted average of 96.9%. Similarly, the statistical analysis conducted on geographies consisting of 197,973,709 people shows a weak positive correlation between the proportion of Immigrants from Malaysia and percentage of population with at least 7th grade education in the United States with a correlation coefficient (R) of 0.273 and weighted average of 95.6%, a difference of 1.3%.
7th Grade Correlation Summary
| Measurement | Immigrants from North America | Immigrants from Malaysia |
| Minimum | 87.6% | 88.6% |
| Maximum | 100.0% | 100.0% |
| Range | 12.4% | 11.4% |
| Mean | 98.1% | 96.6% |
| Median | 98.8% | 96.8% |
| Interquartile 25% (IQ1) | 97.9% | 95.6% |
| Interquartile 75% (IQ3) | 100.0% | 99.0% |
| Interquartile Range (IQR) | 2.1% | 3.4% |
| Standard Deviation (Sample) | 2.8% | 3.0% |
| Standard Deviation (Population) | 2.8% | 3.0% |
Similar Demographics by 7th Grade
Demographics Similar to Immigrants from North America by 7th Grade
In terms of 7th grade, the demographic groups most similar to Immigrants from North America are Immigrants from Canada (96.9%, a difference of 0.010%), Creek (96.9%, a difference of 0.010%), Immigrants from Northern Europe (96.9%, a difference of 0.010%), White/Caucasian (97.0%, a difference of 0.020%), and Macedonian (97.0%, a difference of 0.020%).
| Demographics | Rating | Rank | 7th Grade |
| Russians | 99.8 /100 | #55 | Exceptional 97.0% |
| Serbians | 99.8 /100 | #56 | Exceptional 97.0% |
| Americans | 99.8 /100 | #57 | Exceptional 97.0% |
| Whites/Caucasians | 99.8 /100 | #58 | Exceptional 97.0% |
| Macedonians | 99.8 /100 | #59 | Exceptional 97.0% |
| Immigrants | Canada | 99.8 /100 | #60 | Exceptional 96.9% |
| Creek | 99.8 /100 | #61 | Exceptional 96.9% |
| Immigrants | North America | 99.8 /100 | #62 | Exceptional 96.9% |
| Immigrants | Northern Europe | 99.7 /100 | #63 | Exceptional 96.9% |
| Immigrants | Austria | 99.7 /100 | #64 | Exceptional 96.9% |
| Canadians | 99.7 /100 | #65 | Exceptional 96.9% |
| Ukrainians | 99.7 /100 | #66 | Exceptional 96.9% |
| Native Hawaiians | 99.7 /100 | #67 | Exceptional 96.9% |
| Immigrants | India | 99.6 /100 | #68 | Exceptional 96.9% |
| Iranians | 99.6 /100 | #69 | Exceptional 96.8% |
Demographics Similar to Immigrants from Malaysia by 7th Grade
In terms of 7th grade, the demographic groups most similar to Immigrants from Malaysia are Immigrants from Syria (95.7%, a difference of 0.010%), Immigrants from Oceania (95.7%, a difference of 0.010%), Immigrants from Eastern Asia (95.6%, a difference of 0.010%), Subsaharan African (95.7%, a difference of 0.020%), and Samoan (95.7%, a difference of 0.020%).
| Demographics | Rating | Rank | 7th Grade |
| Immigrants | Liberia | 8.1 /100 | #218 | Tragic 95.7% |
| Immigrants | Southern Europe | 7.9 /100 | #219 | Tragic 95.7% |
| Sub-Saharan Africans | 7.2 /100 | #220 | Tragic 95.7% |
| Samoans | 7.0 /100 | #221 | Tragic 95.7% |
| Laotians | 6.8 /100 | #222 | Tragic 95.7% |
| Immigrants | Syria | 6.7 /100 | #223 | Tragic 95.7% |
| Immigrants | Oceania | 6.7 /100 | #224 | Tragic 95.7% |
| Immigrants | Malaysia | 6.2 /100 | #225 | Tragic 95.6% |
| Immigrants | Eastern Asia | 5.8 /100 | #226 | Tragic 95.6% |
| Immigrants | Western Asia | 5.4 /100 | #227 | Tragic 95.6% |
| Immigrants | Eastern Africa | 5.1 /100 | #228 | Tragic 95.6% |
| Immigrants | Panama | 4.9 /100 | #229 | Tragic 95.6% |
| Natives/Alaskans | 4.2 /100 | #230 | Tragic 95.6% |
| Senegalese | 4.0 /100 | #231 | Tragic 95.6% |
| Costa Ricans | 3.3 /100 | #232 | Tragic 95.5% |