Immigrants from North America vs Immigrants from Bulgaria No Schooling Completed
COMPARE
Immigrants from North America
Immigrants from Bulgaria
No Schooling Completed
No Schooling Completed Comparison
Immigrants from North America
Immigrants from Bulgaria
1.6%
NO SCHOOLING COMPLETED
99.8/ 100
METRIC RATING
56th/ 347
METRIC RANK
1.9%
NO SCHOOLING COMPLETED
94.6/ 100
METRIC RATING
120th/ 347
METRIC RANK
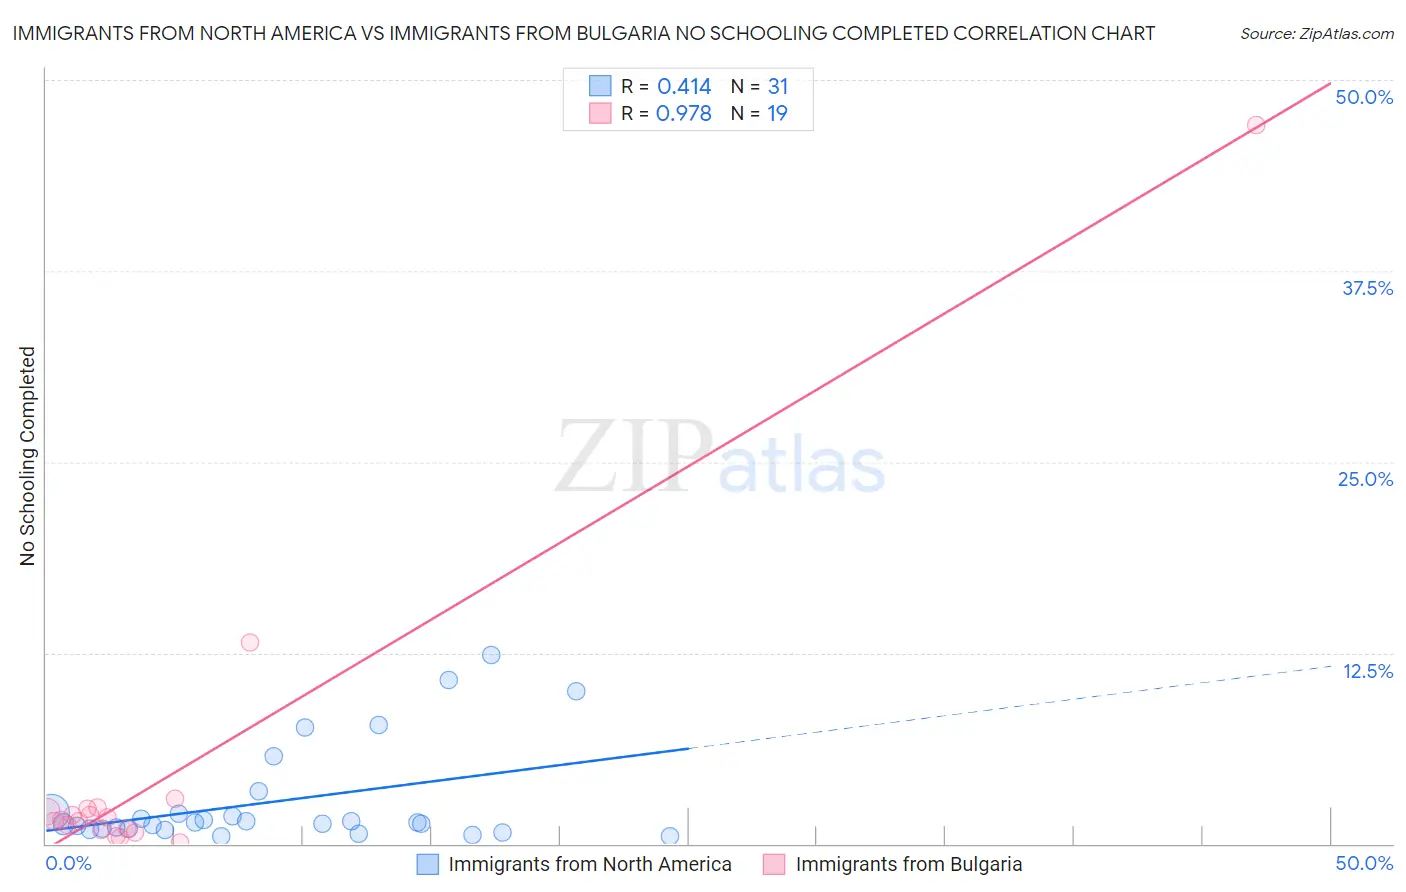
Immigrants from North America vs Immigrants from Bulgaria No Schooling Completed Correlation Chart
The statistical analysis conducted on geographies consisting of 454,496,769 people shows a moderate positive correlation between the proportion of Immigrants from North America and percentage of population with no schooling in the United States with a correlation coefficient (R) of 0.414 and weighted average of 1.6%. Similarly, the statistical analysis conducted on geographies consisting of 171,926,286 people shows a perfect positive correlation between the proportion of Immigrants from Bulgaria and percentage of population with no schooling in the United States with a correlation coefficient (R) of 0.978 and weighted average of 1.9%, a difference of 15.1%.
No Schooling Completed Correlation Summary
| Measurement | Immigrants from North America | Immigrants from Bulgaria |
| Minimum | 0.45% | 0.085% |
| Maximum | 12.4% | 47.1% |
| Range | 11.9% | 47.0% |
| Mean | 2.8% | 4.5% |
| Median | 1.4% | 1.5% |
| Interquartile 25% (IQ1) | 1.00% | 0.90% |
| Interquartile 75% (IQ3) | 2.1% | 2.3% |
| Interquartile Range (IQR) | 1.1% | 1.4% |
| Standard Deviation (Sample) | 3.3% | 10.7% |
| Standard Deviation (Population) | 3.3% | 10.4% |
Similar Demographics by No Schooling Completed
Demographics Similar to Immigrants from North America by No Schooling Completed
In terms of no schooling completed, the demographic groups most similar to Immigrants from North America are Greek (1.6%, a difference of 0.0%), Crow (1.6%, a difference of 0.12%), Creek (1.6%, a difference of 0.15%), Immigrants from Canada (1.6%, a difference of 0.28%), and Austrian (1.6%, a difference of 0.31%).
| Demographics | Rating | Rank | No Schooling Completed |
| Whites/Caucasians | 99.9 /100 | #49 | Exceptional 1.6% |
| Celtics | 99.9 /100 | #50 | Exceptional 1.6% |
| Chippewa | 99.8 /100 | #51 | Exceptional 1.6% |
| Immigrants | Canada | 99.8 /100 | #52 | Exceptional 1.6% |
| Creek | 99.8 /100 | #53 | Exceptional 1.6% |
| Crow | 99.8 /100 | #54 | Exceptional 1.6% |
| Greeks | 99.8 /100 | #55 | Exceptional 1.6% |
| Immigrants | North America | 99.8 /100 | #56 | Exceptional 1.6% |
| Austrians | 99.8 /100 | #57 | Exceptional 1.6% |
| Kiowa | 99.8 /100 | #58 | Exceptional 1.6% |
| Slavs | 99.8 /100 | #59 | Exceptional 1.7% |
| Americans | 99.8 /100 | #60 | Exceptional 1.7% |
| Tsimshian | 99.8 /100 | #61 | Exceptional 1.7% |
| Immigrants | Northern Europe | 99.8 /100 | #62 | Exceptional 1.7% |
| Russians | 99.8 /100 | #63 | Exceptional 1.7% |
Demographics Similar to Immigrants from Bulgaria by No Schooling Completed
In terms of no schooling completed, the demographic groups most similar to Immigrants from Bulgaria are Immigrants from Croatia (1.9%, a difference of 0.060%), Cree (1.9%, a difference of 0.090%), Iroquois (1.9%, a difference of 0.40%), Immigrants from Kuwait (1.9%, a difference of 0.46%), and Cambodian (1.9%, a difference of 0.53%).
| Demographics | Rating | Rank | No Schooling Completed |
| Immigrants | Zimbabwe | 96.2 /100 | #113 | Exceptional 1.9% |
| Immigrants | Norway | 96.1 /100 | #114 | Exceptional 1.9% |
| Syrians | 96.0 /100 | #115 | Exceptional 1.9% |
| Lebanese | 96.0 /100 | #116 | Exceptional 1.9% |
| Immigrants | Serbia | 95.8 /100 | #117 | Exceptional 1.9% |
| Spanish | 95.5 /100 | #118 | Exceptional 1.9% |
| Iroquois | 95.1 /100 | #119 | Exceptional 1.9% |
| Immigrants | Bulgaria | 94.6 /100 | #120 | Exceptional 1.9% |
| Immigrants | Croatia | 94.5 /100 | #121 | Exceptional 1.9% |
| Cree | 94.5 /100 | #122 | Exceptional 1.9% |
| Immigrants | Kuwait | 93.9 /100 | #123 | Exceptional 1.9% |
| Cambodians | 93.8 /100 | #124 | Exceptional 1.9% |
| Immigrants | Europe | 93.7 /100 | #125 | Exceptional 1.9% |
| Immigrants | Romania | 92.6 /100 | #126 | Exceptional 1.9% |
| Israelis | 92.4 /100 | #127 | Exceptional 1.9% |