Immigrants from Nigeria vs Welsh 3rd Grade
COMPARE
Immigrants from Nigeria
Welsh
3rd Grade
3rd Grade Comparison
Immigrants from Nigeria
Welsh
97.3%
3RD GRADE
0.3/ 100
METRIC RATING
267th/ 347
METRIC RANK
98.8%
3RD GRADE
100.0/ 100
METRIC RATING
3rd/ 347
METRIC RANK
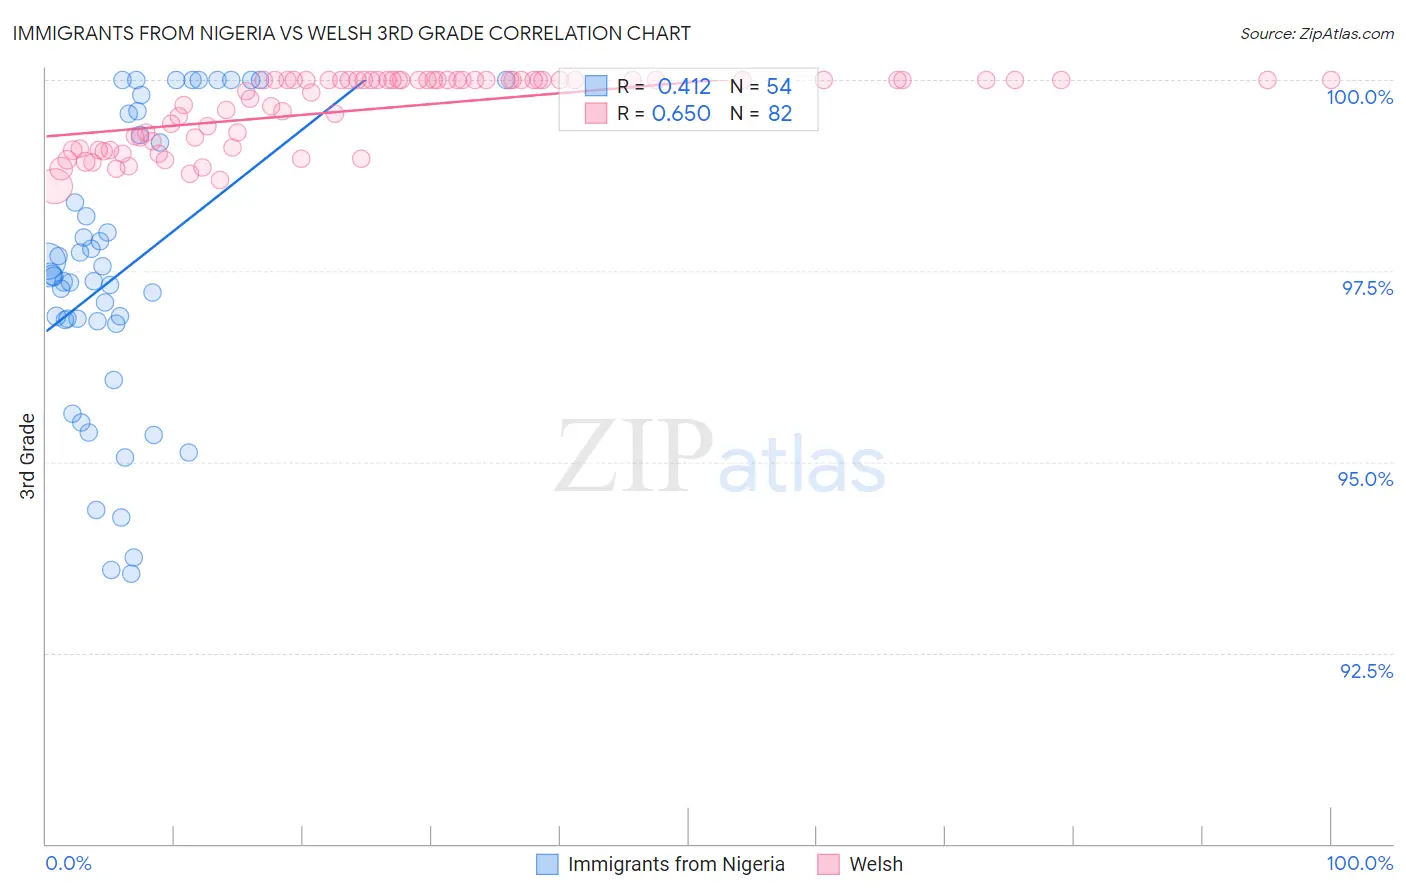
Immigrants from Nigeria vs Welsh 3rd Grade Correlation Chart
The statistical analysis conducted on geographies consisting of 283,430,369 people shows a moderate positive correlation between the proportion of Immigrants from Nigeria and percentage of population with at least 3rd grade education in the United States with a correlation coefficient (R) of 0.412 and weighted average of 97.3%. Similarly, the statistical analysis conducted on geographies consisting of 239,959,962 people shows a significant positive correlation between the proportion of Welsh and percentage of population with at least 3rd grade education in the United States with a correlation coefficient (R) of 0.650 and weighted average of 98.8%, a difference of 1.6%.
3rd Grade Correlation Summary
| Measurement | Immigrants from Nigeria | Welsh |
| Minimum | 93.5% | 98.6% |
| Maximum | 100.0% | 100.0% |
| Range | 6.5% | 1.4% |
| Mean | 97.5% | 99.6% |
| Median | 97.4% | 100.0% |
| Interquartile 25% (IQ1) | 96.8% | 99.1% |
| Interquartile 75% (IQ3) | 99.3% | 100.0% |
| Interquartile Range (IQR) | 2.4% | 0.89% |
| Standard Deviation (Sample) | 1.9% | 0.46% |
| Standard Deviation (Population) | 1.8% | 0.46% |
Similar Demographics by 3rd Grade
Demographics Similar to Immigrants from Nigeria by 3rd Grade
In terms of 3rd grade, the demographic groups most similar to Immigrants from Nigeria are Yaqui (97.3%, a difference of 0.0%), Immigrants from Jamaica (97.3%, a difference of 0.010%), Cuban (97.3%, a difference of 0.010%), Fijian (97.3%, a difference of 0.010%), and Taiwanese (97.3%, a difference of 0.020%).
| Demographics | Rating | Rank | 3rd Grade |
| Immigrants | Ethiopia | 0.4 /100 | #260 | Tragic 97.3% |
| Immigrants | South America | 0.4 /100 | #261 | Tragic 97.3% |
| Immigrants | Sierra Leone | 0.4 /100 | #262 | Tragic 97.3% |
| Taiwanese | 0.3 /100 | #263 | Tragic 97.3% |
| West Indians | 0.3 /100 | #264 | Tragic 97.3% |
| Immigrants | Jamaica | 0.3 /100 | #265 | Tragic 97.3% |
| Yaqui | 0.3 /100 | #266 | Tragic 97.3% |
| Immigrants | Nigeria | 0.3 /100 | #267 | Tragic 97.3% |
| Cubans | 0.2 /100 | #268 | Tragic 97.3% |
| Fijians | 0.2 /100 | #269 | Tragic 97.3% |
| Immigrants | China | 0.2 /100 | #270 | Tragic 97.2% |
| Puerto Ricans | 0.2 /100 | #271 | Tragic 97.2% |
| Ghanaians | 0.1 /100 | #272 | Tragic 97.2% |
| Immigrants | Peru | 0.1 /100 | #273 | Tragic 97.2% |
| Immigrants | Cameroon | 0.1 /100 | #274 | Tragic 97.2% |
Demographics Similar to Welsh by 3rd Grade
In terms of 3rd grade, the demographic groups most similar to Welsh are Inupiat (98.8%, a difference of 0.030%), Tsimshian (98.8%, a difference of 0.040%), Alaskan Athabascan (98.7%, a difference of 0.13%), Norwegian (98.6%, a difference of 0.17%), and Slovak (98.6%, a difference of 0.19%).
| Demographics | Rating | Rank | 3rd Grade |
| Crow | 100.0 /100 | #1 | Exceptional 99.6% |
| Yup'ik | 100.0 /100 | #2 | Exceptional 99.0% |
| Welsh | 100.0 /100 | #3 | Exceptional 98.8% |
| Inupiat | 100.0 /100 | #4 | Exceptional 98.8% |
| Tsimshian | 100.0 /100 | #5 | Exceptional 98.8% |
| Alaskan Athabascans | 100.0 /100 | #6 | Exceptional 98.7% |
| Norwegians | 100.0 /100 | #7 | Exceptional 98.6% |
| Slovaks | 100.0 /100 | #8 | Exceptional 98.6% |
| Germans | 100.0 /100 | #9 | Exceptional 98.6% |
| Alaska Natives | 100.0 /100 | #10 | Exceptional 98.6% |
| Slovenes | 100.0 /100 | #11 | Exceptional 98.6% |
| English | 100.0 /100 | #12 | Exceptional 98.6% |
| Tlingit-Haida | 100.0 /100 | #13 | Exceptional 98.5% |
| Carpatho Rusyns | 100.0 /100 | #14 | Exceptional 98.5% |
| Swedes | 100.0 /100 | #15 | Exceptional 98.5% |