Immigrants from Nigeria vs Immigrants from Northern Africa Master's Degree
COMPARE
Immigrants from Nigeria
Immigrants from Northern Africa
Master's Degree
Master's Degree Comparison
Immigrants from Nigeria
Immigrants from Northern Africa
14.6%
MASTER'S DEGREE
32.7/ 100
METRIC RATING
193rd/ 347
METRIC RANK
17.1%
MASTER'S DEGREE
98.9/ 100
METRIC RATING
96th/ 347
METRIC RANK
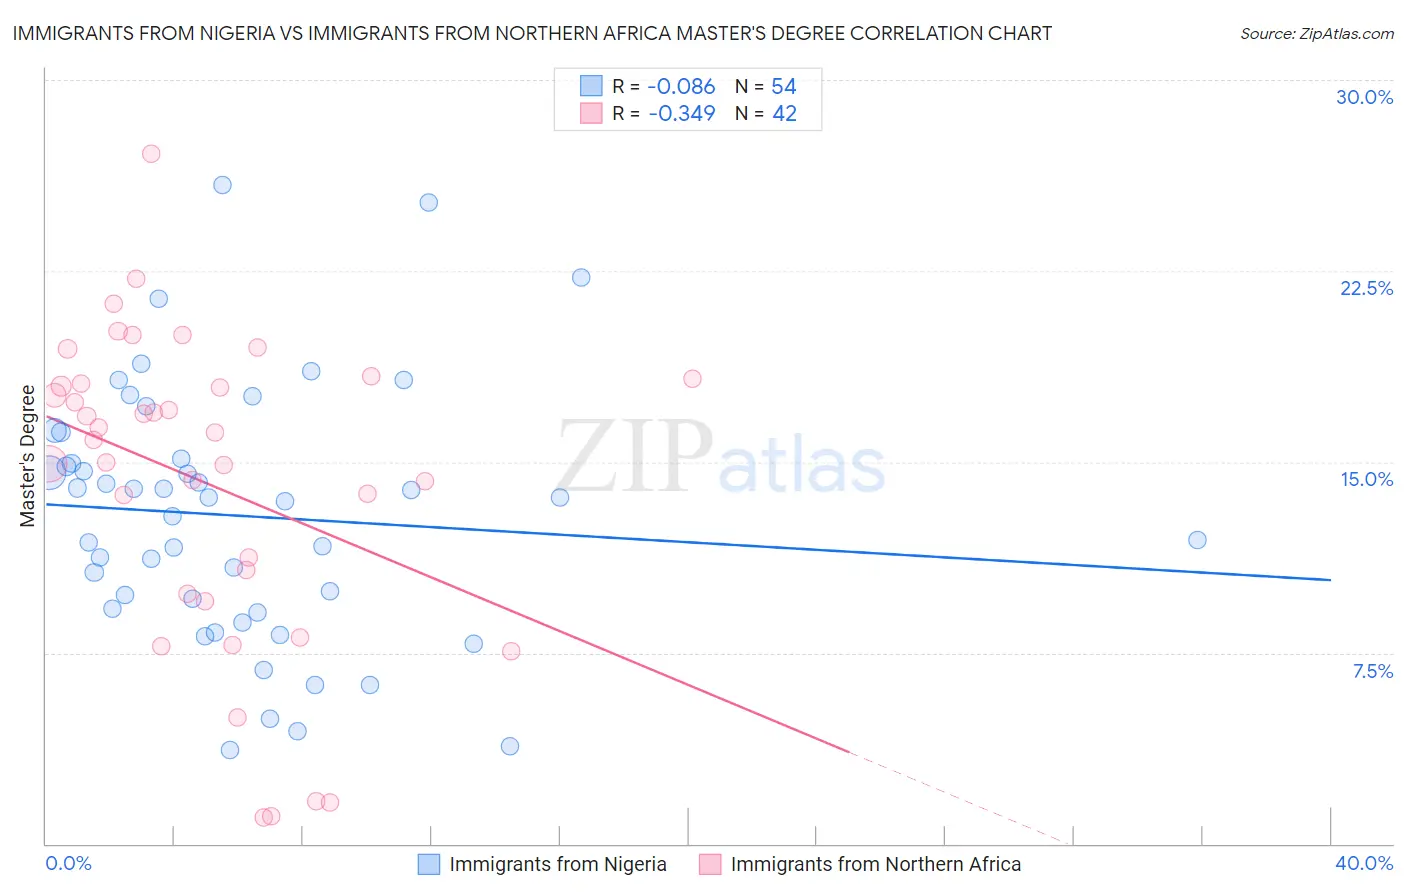
Immigrants from Nigeria vs Immigrants from Northern Africa Master's Degree Correlation Chart
The statistical analysis conducted on geographies consisting of 283,420,581 people shows a slight negative correlation between the proportion of Immigrants from Nigeria and percentage of population with at least master's degree education in the United States with a correlation coefficient (R) of -0.086 and weighted average of 14.6%. Similarly, the statistical analysis conducted on geographies consisting of 321,156,362 people shows a mild negative correlation between the proportion of Immigrants from Northern Africa and percentage of population with at least master's degree education in the United States with a correlation coefficient (R) of -0.349 and weighted average of 17.1%, a difference of 17.1%.
Master's Degree Correlation Summary
| Measurement | Immigrants from Nigeria | Immigrants from Northern Africa |
| Minimum | 3.7% | 1.0% |
| Maximum | 25.9% | 27.1% |
| Range | 22.2% | 26.1% |
| Mean | 12.9% | 14.2% |
| Median | 13.5% | 16.0% |
| Interquartile 25% (IQ1) | 9.2% | 9.8% |
| Interquartile 75% (IQ3) | 15.1% | 18.1% |
| Interquartile Range (IQR) | 5.9% | 8.2% |
| Standard Deviation (Sample) | 5.0% | 6.1% |
| Standard Deviation (Population) | 5.0% | 6.1% |
Similar Demographics by Master's Degree
Demographics Similar to Immigrants from Nigeria by Master's Degree
In terms of master's degree, the demographic groups most similar to Immigrants from Nigeria are Chinese (14.6%, a difference of 0.040%), Immigrants from Middle Africa (14.6%, a difference of 0.13%), Welsh (14.6%, a difference of 0.22%), Danish (14.5%, a difference of 0.22%), and Czechoslovakian (14.5%, a difference of 0.43%).
| Demographics | Rating | Rank | Master's Degree |
| Immigrants | Oceania | 37.1 /100 | #186 | Fair 14.7% |
| Basques | 36.5 /100 | #187 | Fair 14.7% |
| Immigrants | Costa Rica | 36.2 /100 | #188 | Fair 14.7% |
| Immigrants | Immigrants | 36.0 /100 | #189 | Fair 14.6% |
| Spaniards | 35.8 /100 | #190 | Fair 14.6% |
| Welsh | 34.2 /100 | #191 | Fair 14.6% |
| Immigrants | Middle Africa | 33.6 /100 | #192 | Fair 14.6% |
| Immigrants | Nigeria | 32.7 /100 | #193 | Fair 14.6% |
| Chinese | 32.5 /100 | #194 | Fair 14.6% |
| Danes | 31.3 /100 | #195 | Fair 14.5% |
| Czechoslovakians | 29.9 /100 | #196 | Fair 14.5% |
| Belgians | 28.0 /100 | #197 | Fair 14.5% |
| West Indians | 27.4 /100 | #198 | Fair 14.5% |
| Immigrants | Armenia | 27.2 /100 | #199 | Fair 14.5% |
| Panamanians | 25.1 /100 | #200 | Fair 14.4% |
Demographics Similar to Immigrants from Northern Africa by Master's Degree
In terms of master's degree, the demographic groups most similar to Immigrants from Northern Africa are Immigrants from Morocco (17.1%, a difference of 0.030%), Immigrants from England (17.0%, a difference of 0.16%), Immigrants from Ukraine (17.0%, a difference of 0.26%), Laotian (17.0%, a difference of 0.32%), and Ugandan (17.1%, a difference of 0.34%).
| Demographics | Rating | Rank | Master's Degree |
| Bhutanese | 99.1 /100 | #89 | Exceptional 17.2% |
| Immigrants | Egypt | 99.1 /100 | #90 | Exceptional 17.2% |
| Romanians | 99.1 /100 | #91 | Exceptional 17.2% |
| Immigrants | North America | 99.1 /100 | #92 | Exceptional 17.2% |
| Immigrants | Italy | 99.1 /100 | #93 | Exceptional 17.2% |
| Ugandans | 99.0 /100 | #94 | Exceptional 17.1% |
| Immigrants | Morocco | 98.9 /100 | #95 | Exceptional 17.1% |
| Immigrants | Northern Africa | 98.9 /100 | #96 | Exceptional 17.1% |
| Immigrants | England | 98.8 /100 | #97 | Exceptional 17.0% |
| Immigrants | Ukraine | 98.8 /100 | #98 | Exceptional 17.0% |
| Laotians | 98.8 /100 | #99 | Exceptional 17.0% |
| Albanians | 98.7 /100 | #100 | Exceptional 17.0% |
| Immigrants | Nepal | 98.6 /100 | #101 | Exceptional 17.0% |
| Chileans | 98.6 /100 | #102 | Exceptional 16.9% |
| Alsatians | 98.4 /100 | #103 | Exceptional 16.9% |