Immigrants from Nigeria vs Immigrants from the Azores College, Under 1 year
COMPARE
Immigrants from Nigeria
Immigrants from the Azores
College, Under 1 year
College, Under 1 year Comparison
Immigrants from Nigeria
Immigrants from the Azores
63.7%
COLLEGE, UNDER 1 YEAR
8.8/ 100
METRIC RATING
214th/ 347
METRIC RANK
54.7%
COLLEGE, UNDER 1 YEAR
0.0/ 100
METRIC RATING
334th/ 347
METRIC RANK
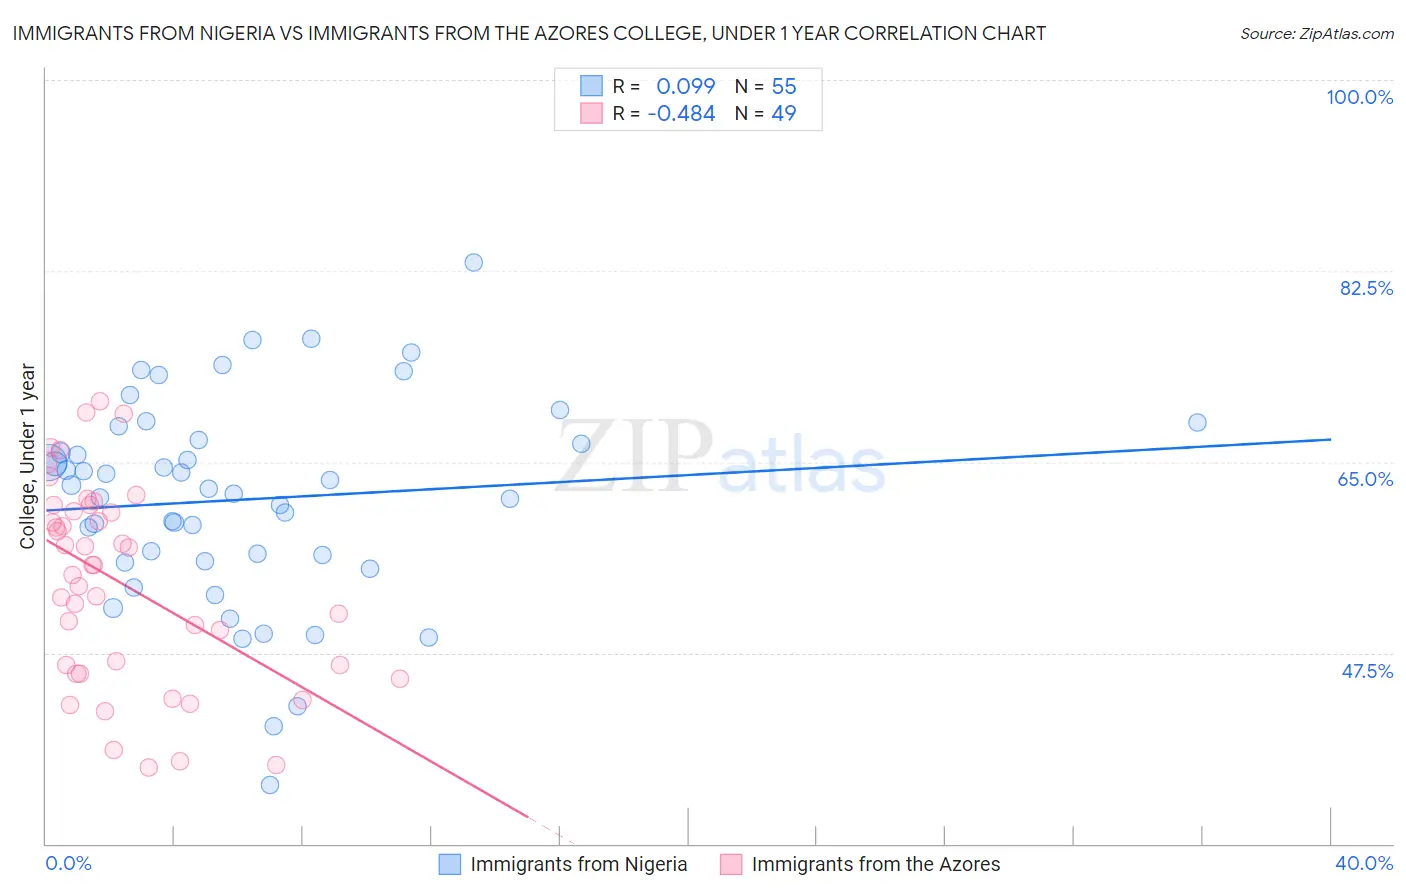
Immigrants from Nigeria vs Immigrants from the Azores College, Under 1 year Correlation Chart
The statistical analysis conducted on geographies consisting of 283,490,343 people shows a slight positive correlation between the proportion of Immigrants from Nigeria and percentage of population with at least college, under 1 year education in the United States with a correlation coefficient (R) of 0.099 and weighted average of 63.7%. Similarly, the statistical analysis conducted on geographies consisting of 46,257,310 people shows a moderate negative correlation between the proportion of Immigrants from the Azores and percentage of population with at least college, under 1 year education in the United States with a correlation coefficient (R) of -0.484 and weighted average of 54.7%, a difference of 16.6%.
College, Under 1 year Correlation Summary
| Measurement | Immigrants from Nigeria | Immigrants from the Azores |
| Minimum | 35.4% | 36.9% |
| Maximum | 83.3% | 70.6% |
| Range | 47.9% | 33.6% |
| Mean | 61.5% | 53.9% |
| Median | 62.6% | 55.6% |
| Interquartile 25% (IQ1) | 55.9% | 46.0% |
| Interquartile 75% (IQ3) | 67.0% | 60.8% |
| Interquartile Range (IQR) | 11.0% | 14.8% |
| Standard Deviation (Sample) | 9.4% | 9.1% |
| Standard Deviation (Population) | 9.3% | 9.0% |
Similar Demographics by College, Under 1 year
Demographics Similar to Immigrants from Nigeria by College, Under 1 year
In terms of college, under 1 year, the demographic groups most similar to Immigrants from Nigeria are Immigrants from South America (63.8%, a difference of 0.040%), Senegalese (63.6%, a difference of 0.17%), Immigrants from Middle Africa (63.9%, a difference of 0.22%), Native Hawaiian (63.9%, a difference of 0.23%), and Ghanaian (63.9%, a difference of 0.30%).
| Demographics | Rating | Rank | College, Under 1 year |
| Colombians | 12.4 /100 | #207 | Poor 64.0% |
| Immigrants | Vietnam | 12.1 /100 | #208 | Poor 64.0% |
| Puget Sound Salish | 11.3 /100 | #209 | Poor 63.9% |
| Ghanaians | 11.2 /100 | #210 | Poor 63.9% |
| Native Hawaiians | 10.6 /100 | #211 | Poor 63.9% |
| Immigrants | Middle Africa | 10.5 /100 | #212 | Poor 63.9% |
| Immigrants | South America | 9.1 /100 | #213 | Tragic 63.8% |
| Immigrants | Nigeria | 8.8 /100 | #214 | Tragic 63.7% |
| Senegalese | 7.7 /100 | #215 | Tragic 63.6% |
| Hmong | 6.8 /100 | #216 | Tragic 63.5% |
| Immigrants | Uruguay | 5.8 /100 | #217 | Tragic 63.4% |
| Immigrants | Panama | 5.7 /100 | #218 | Tragic 63.4% |
| Immigrants | Fiji | 5.7 /100 | #219 | Tragic 63.4% |
| Portuguese | 5.6 /100 | #220 | Tragic 63.4% |
| Cree | 5.2 /100 | #221 | Tragic 63.3% |
Demographics Similar to Immigrants from the Azores by College, Under 1 year
In terms of college, under 1 year, the demographic groups most similar to Immigrants from the Azores are Inupiat (54.6%, a difference of 0.13%), Pennsylvania German (54.5%, a difference of 0.30%), Immigrants from Central America (54.4%, a difference of 0.45%), Yuman (55.1%, a difference of 0.72%), and Lumbee (54.2%, a difference of 0.86%).
| Demographics | Rating | Rank | College, Under 1 year |
| Immigrants | Guatemala | 0.0 /100 | #327 | Tragic 56.2% |
| Cape Verdeans | 0.0 /100 | #328 | Tragic 56.0% |
| Immigrants | Cuba | 0.0 /100 | #329 | Tragic 55.7% |
| Mexicans | 0.0 /100 | #330 | Tragic 55.6% |
| Dominicans | 0.0 /100 | #331 | Tragic 55.5% |
| Immigrants | Yemen | 0.0 /100 | #332 | Tragic 55.3% |
| Yuman | 0.0 /100 | #333 | Tragic 55.1% |
| Immigrants | Azores | 0.0 /100 | #334 | Tragic 54.7% |
| Inupiat | 0.0 /100 | #335 | Tragic 54.6% |
| Pennsylvania Germans | 0.0 /100 | #336 | Tragic 54.5% |
| Immigrants | Central America | 0.0 /100 | #337 | Tragic 54.4% |
| Lumbee | 0.0 /100 | #338 | Tragic 54.2% |
| Immigrants | Dominican Republic | 0.0 /100 | #339 | Tragic 54.0% |
| Spanish American Indians | 0.0 /100 | #340 | Tragic 54.0% |
| Immigrants | Cabo Verde | 0.0 /100 | #341 | Tragic 53.7% |